
Figure 12
- ID
- ZDB-FIG-241115-103
- Publication
- Ono et al., 2024 - Contributions of mirror-image hair cell orientation to mouse otolith organ and zebrafish neuromast function
- Other Figures
- All Figure Page
- Back to All Figure Page
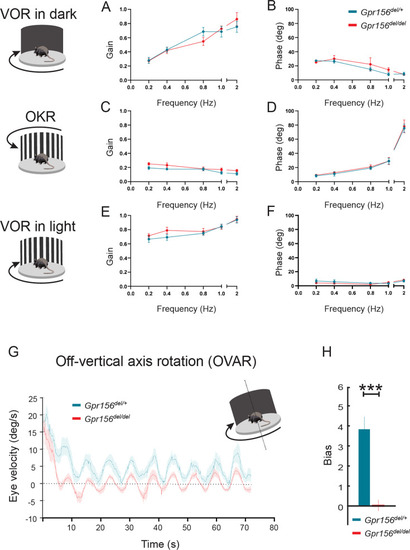
VOR and OKR responses were normal but OVAR responses were altered in Gpr156del/delmice. (A–B) VORd gain and phase (mean ± SEM) plotted as a function of frequency for control and Gpr156del/del mice. N is 8 and 7 for control (green) and Gpr156del/del KO (red) mice respectively. (C–D) OKR gain and phase (mean ± SEM) plotted as a function of frequency for control and Gpr156del/del mice. (E–F) VORl gain and phase (mean ± SEM) plotted as a function of frequency for control and Gpr156del/del mice. (G) Average eye velocities (mean ± SEM) during 72s-long off-vertical axis rotation for control and Gpr156del/del mice. N is 8 and 7 for control (green) and Gpr156-/- (red) mice respectively. (H) OVAR bias during the steady state (mean ± SEM) for control and Gpr156del/del mice. ***p<0.001. |