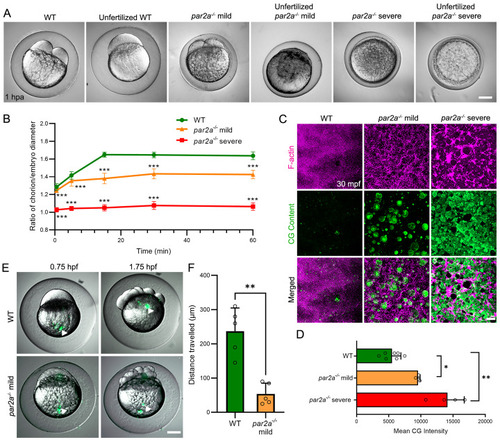
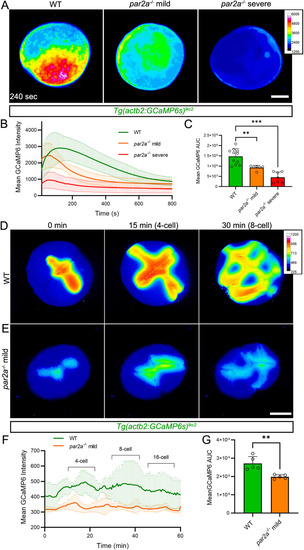
Serine protease inhibitors cause egg activation defects and reduced calcium waves.

A, B: Eggs fertilized in vitro in E2 medium with (B) or without (A) 5mg/ml Aprotinin. C, D: Normalized pseudo-coloured fluorescent images of eggs harvested from a Tg(actb2:GCaMP6s)lkc2 female, indicating Ca++ levels at 5 min postactivation (mpa) in E2 (C) or in 5mg/ml Aprotinin (D). E: Changes in GCaMP6s intensity over 10 min of Tg(actb2:GCaMP6s)lkc2 eggs activated with E2 (black) or 5 mg/ml Aprotinin (red). F: Corresponding Area Under Curve of GCaMP6 intensity levels presented in (E) following egg activation. n=4; Mann–Whitney test; * = p < 0.05. G–I′: Low (G, H, I) and high (G′, H, I′) magnification images of embryos fertilized in vitro in E2 (G–G′), or in E2 with 40 mg/ml Benzamidine HCl treatment and subsequently injected with 0.7 mM KCl (H–H′), or in E2 with 40 mg/ml Benzamidine HCl treatment and injected with 10 mM IP3 in KCl (I–I′). J: Proportion of embryos showing egg activation phenotypes and blastomere division. Benzamidine incubation aborts egg activation, which can be reactivated by IP3 injection. Key: CL: Chorion Lift, BD: Blastodisc, CD: Cell Division, +: Present, −: Absent. Chi-squared analyses; *** = p<0.001. Scale bars: B, I = 500 µm; D, I′ = 200 µm. See file S1 Data for underlying data.

Maternal par2a mutant embryos display impaired egg activation events and cell division defects.

A: Nomarski images of naturally fertilized and unfertilized, activated eggs from WT, mild and severe par2a mutant females. Chorion elevation and blastodisc formation are variably disrupted. B: Changes in the ratio of chorion lift to embryo size of naturally fertilized WT, mild and severe par2a mutant eggs at different time points over an hour postactivation, n=51; t-test; *** = p<0.001. C: Confocal images of F-actin (magenta) and cortical granule (CG Content; green) distribution in naturally fertilized WT (left), par2a mild (middle), and par2a severe (right) mutant eggs at 30 mpf. par2a mutants show retention of F-actin meshwork that correlates with retention of CGs at cortex. D: Quantification of CG content staining at cortex in fertilized WT, mild and severe par2a mutant eggs at 30 mpf. n = 7, 3, 4; Mann–Whitney test; * = p<0.05; ** = p<0.01. E: Fluorescent eGFP superimposed on Nomarski image of naturally fertilized WT and mild par2a mutants injected with fluorescent latex beads at the vegetal pole (left column). Bead movement is recorded 1 h later (right column). Arrowheads highlight latex bead position. F: Average distance traveled by injected fluorescent latex beads over 1 h in naturally fertilized WT and mild par2a mutant eggs. n = 5; Mann–Whitney test; ** = p<0.001. Scale bars: A, E = 200 µm; C = 20 µm. See file S1 Data for underlying data.

par2a mutants show defective Ca++ wave propagation during egg activation and blastomere cytokinesis.

A Normalized pseudo-coloured fluorescent images of Tg(actb2:GCaMP6s)lkc2 indicating comparative Ca++ levels at 240 s postegg activation in WT, mild and severe par2a mutant eggs. B: Changes in GCaMP6s intensity over 10 min from the Tg(actb2:GCaMP6s)lkc2 Ca++ reporter transgene of WT (green), mild par2a (yellow) and severe par2a (red) mutants following egg activation. C: Graph of corresponding Area Under Curve analysis of GCaMP6s levels presented in (B). n = 11,6,7; Mann–Whitney test; ** = P < 0.01; *** = p < 0.001. D, E: Projected light-sheet images of the animal pole of Tg(actb2:GCaMP6s)lkc2 in naturally fertilized WT (D) and mild par2a mutant eggs (E) during cell division over 30 min starting from 2-cell stage. F: Changes in GCaMP6s intensity over 1 h in WT (green) and mild par2a mutant embryos (yellow) during early blastomere division. Acquisition begins at 20 mpf and cell division events are indicated above WT by brackets. G: Graph of corresponding Area Under Curve analysis of GCaMP6s levels presented in (F). n = 5; Mann–Whitney test; ** = p < 0.01. Scale bars: A, E = 200 µm. See file S1 Data for underlying data.

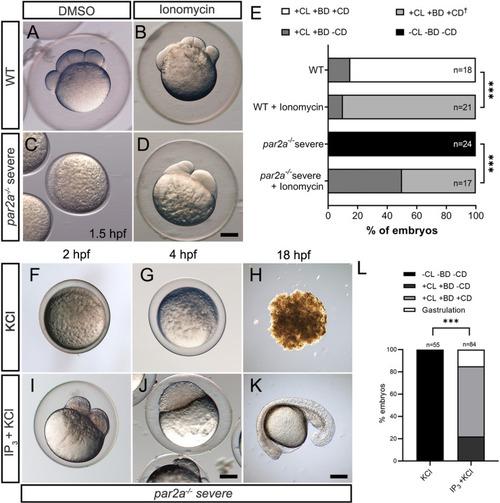
Increasing intracellular Ca2+ either by Ionomycin or IP3 rescues egg activation defects in par2a mutants.

A–D: Images of WT (A, B) or severe par2a mutants (C, D) embryos derived from natural spawning and treated with 0.1% DMSO (A, C) or 2 µM Ionomycin (B, D). E: Proportion of WT and severe par2a−/− embryos showing egg activation and blastomere division phenotypes at 1.5 hpf following treatment with 0.1% DMSO or 2 µM Ionomycin. Key: CL: Chorion Lift, BD: Blastodisc, CD: Cell Division, +: Present, −: absent. : Abnormal. Chi-squared analyses; *** = p < 0.001. F–K: Images of naturally fertilized severe par2a mutant embryos injected with KCl alone (F, G, H) or with IP3 in KCl (I, J, K) at 2 hpf (F, I), 4 hpf (G, J) and 18 hpf (H, K). L: Proportion of egg activation and blastomere division phenotypes in fertilized severe par2a mutant eggs injected with IP3 in KCl or KCl alone. Key: CL: Chorion Lift, BD: Blastodisc, CD: Cell Division, +: Present, −: absent. Chi-squared analyses; *** = p < 0.001. Scale bars: D, J, K = 200 µm. See file S1 Data for underlying data. IP3 is necessary for zebrafish egg activation.

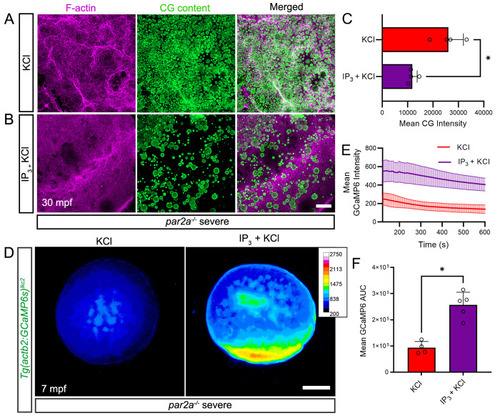
IP3 rescues egg activation defects by increasing intracellular calcium spatially.

A, B: Confocal images of F-actin (left; magenta), and cortical granule (middle; CG Content; green) distribution at the cortex of naturally fertilized severe par2a mutant eggs at 30 mpf. Eggs were injected with KCl alone (A) or with 20 pmol IP3 in KCl (B). C: Quantification of CG content staining intensity in fertilized severe par2a mutant eggs injected with KCl alone (red bar) or with IP3 in KCl (purple bar) n = 4; Mann–Whitney test; * = p < 0.05 D: Normalized pseudo-coloured fluorescent images of Tg(actb2:GCaMP6s)lkc2 indicating calcium levels of naturally fertilized severe par2a mutant eggs at 7 min following injection with KCl alone (left) or with IP3 in KCl (right). E: Changes in GCaMP6s intensity reported by the Tg(actb2:GCaMP6s)lkc2 transgene over 10 min in fertilized severe par2a mutants eggs following injection with KCl alone (red line) or with IP3 in KCl (purple line). F: Graph of corresponding Area Under Curve analysis of GCaMP6s levels presented in (E). n = 4, 5; Mann–Whitney test; * = p < 0.05. Scale bars B = 50 µm; D = 200 µm. See file S1 Data for underlying data.

ZFIN is incorporating published figure images and captions as part of an ongoing project. Figures from some publications have not yet been curated, or are not available for display because of copyright restrictions.

Acknowledgments
This image is the copyrighted work of the attributed author or publisher, and ZFIN has permission only to display this image to its users. Additional permissions should be obtained from the applicable author or publisher of the image. Full text @ PLoS Biol.