|
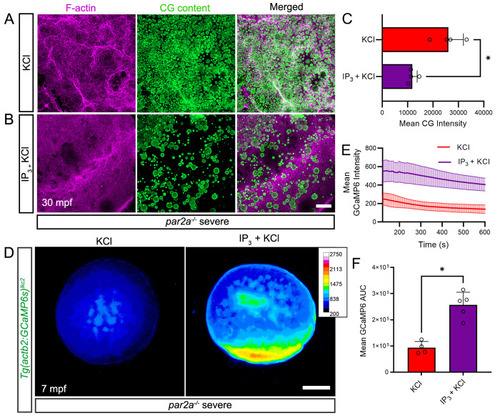
IP3 rescues egg activation defects by increasing intracellular calcium spatially. A, B: Confocal images of F-actin (left; magenta), and cortical granule (middle; CG Content; green) distribution at the cortex of naturally fertilized severe par2a mutant eggs at 30 mpf. Eggs were injected with KCl alone (A) or with 20 pmol IP3 in KCl (B). C: Quantification of CG content staining intensity in fertilized severe par2a mutant eggs injected with KCl alone (red bar) or with IP3 in KCl (purple bar) n = 4; Mann–Whitney test; * = p < 0.05 D: Normalized pseudo-coloured fluorescent images of Tg(actb2:GCaMP6s)lkc2 indicating calcium levels of naturally fertilized severe par2a mutant eggs at 7 min following injection with KCl alone (left) or with IP3 in KCl (right). E: Changes in GCaMP6s intensity reported by the Tg(actb2:GCaMP6s)lkc2 transgene over 10 min in fertilized severe par2a mutants eggs following injection with KCl alone (red line) or with IP3 in KCl (purple line). F: Graph of corresponding Area Under Curve analysis of GCaMP6s levels presented in (E). n = 4, 5; Mann–Whitney test; * = p < 0.05. Scale bars B = 50 µm; D = 200 µm. See file S1 Data for underlying data.
|