|
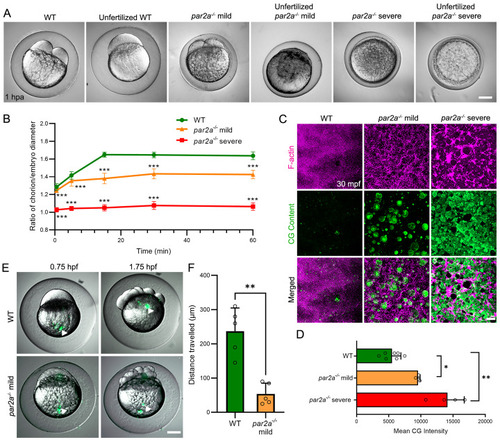
Maternal par2a mutant embryos display impaired egg activation events and cell division defects. A: Nomarski images of naturally fertilized and unfertilized, activated eggs from WT, mild and severe par2a mutant females. Chorion elevation and blastodisc formation are variably disrupted. B: Changes in the ratio of chorion lift to embryo size of naturally fertilized WT, mild and severe par2a mutant eggs at different time points over an hour postactivation, n=51; t-test; *** = p<0.001. C: Confocal images of F-actin (magenta) and cortical granule (CG Content; green) distribution in naturally fertilized WT (left), par2a mild (middle), and par2a severe (right) mutant eggs at 30 mpf. par2a mutants show retention of F-actin meshwork that correlates with retention of CGs at cortex. D: Quantification of CG content staining at cortex in fertilized WT, mild and severe par2a mutant eggs at 30 mpf. n = 7, 3, 4; Mann–Whitney test; * = p<0.05; ** = p<0.01. E: Fluorescent eGFP superimposed on Nomarski image of naturally fertilized WT and mild par2a mutants injected with fluorescent latex beads at the vegetal pole (left column). Bead movement is recorded 1 h later (right column). Arrowheads highlight latex bead position. F: Average distance traveled by injected fluorescent latex beads over 1 h in naturally fertilized WT and mild par2a mutant eggs. n = 5; Mann–Whitney test; ** = p<0.001. Scale bars: A, E = 200 µm; C = 20 µm. See file S1 Data for underlying data.
|