|
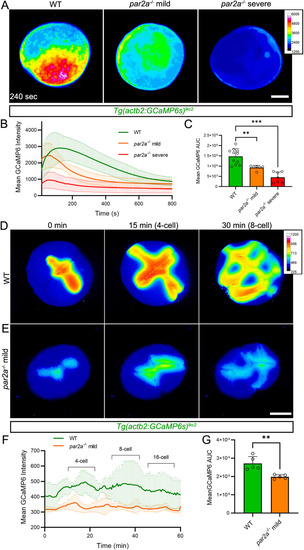
par2a mutants show defective Ca++ wave propagation during egg activation and blastomere cytokinesis. A Normalized pseudo-coloured fluorescent images of Tg(actb2:GCaMP6s)lkc2 indicating comparative Ca++ levels at 240 s postegg activation in WT, mild and severe par2a mutant eggs. B: Changes in GCaMP6s intensity over 10 min from the Tg(actb2:GCaMP6s)lkc2 Ca++ reporter transgene of WT (green), mild par2a (yellow) and severe par2a (red) mutants following egg activation. C: Graph of corresponding Area Under Curve analysis of GCaMP6s levels presented in (B). n = 11,6,7; Mann–Whitney test; ** = P < 0.01; *** = p < 0.001. D, E: Projected light-sheet images of the animal pole of Tg(actb2:GCaMP6s)lkc2 in naturally fertilized WT (D) and mild par2a mutant eggs (E) during cell division over 30 min starting from 2-cell stage. F: Changes in GCaMP6s intensity over 1 h in WT (green) and mild par2a mutant embryos (yellow) during early blastomere division. Acquisition begins at 20 mpf and cell division events are indicated above WT by brackets. G: Graph of corresponding Area Under Curve analysis of GCaMP6s levels presented in (F). n = 5; Mann–Whitney test; ** = p < 0.01. Scale bars: A, E = 200 µm. See file S1 Data for underlying data.
|