IMAGE

Fig 1

ID
ZDB-IMAGE-250620-6
Source
Figures for Ma et al., 2025
Image
Figure Caption

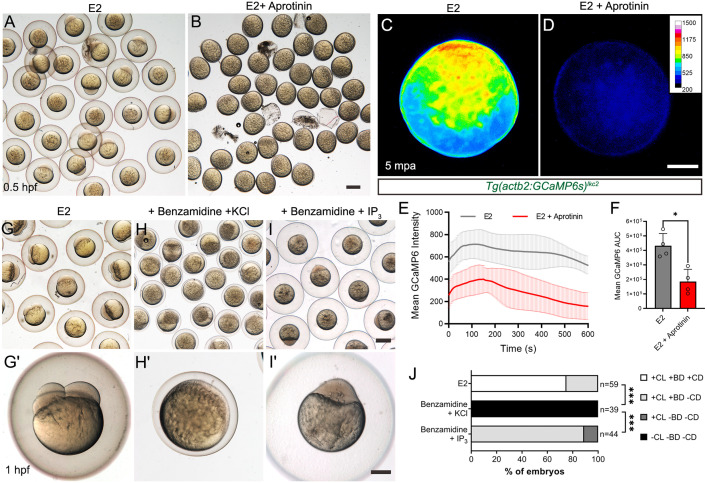
Fig 1 Serine protease inhibitors cause egg activation defects and reduced calcium waves.

A, B: Eggs fertilized in vitro in E2 medium with (B) or without (A) 5mg/ml Aprotinin. C, D: Normalized pseudo-coloured fluorescent images of eggs harvested from a Tg(actb2:GCaMP6s)lkc2 female, indicating Ca++ levels at 5 min postactivation (mpa) in E2 (C) or in 5mg/ml Aprotinin (D). E: Changes in GCaMP6s intensity over 10 min of Tg(actb2:GCaMP6s)lkc2 eggs activated with E2 (black) or 5 mg/ml Aprotinin (red). F: Corresponding Area Under Curve of GCaMP6 intensity levels presented in (E) following egg activation. n=4; Mann–Whitney test; * = p < 0.05. G–I′: Low (G, H, I) and high (G′, H, I′) magnification images of embryos fertilized in vitro in E2 (G–G′), or in E2 with 40 mg/ml Benzamidine HCl treatment and subsequently injected with 0.7 mM KCl (H–H′), or in E2 with 40 mg/ml Benzamidine HCl treatment and injected with 10 mM IP3 in KCl (I–I′). J: Proportion of embryos showing egg activation phenotypes and blastomere division. Benzamidine incubation aborts egg activation, which can be reactivated by IP3 injection. Key: CL: Chorion Lift, BD: Blastodisc, CD: Cell Division, +: Present, −: Absent. Chi-squared analyses; *** = p<0.001. Scale bars: B, I = 500 µm; D, I′ = 200 µm. See file S1 Data for underlying data.

Figure Data
Acknowledgments
This image is the copyrighted work of the attributed author or publisher, and ZFIN has permission only to display this image to its users. Additional permissions should be obtained from the applicable author or publisher of the image. Full text @ PLoS Biol.