IMAGE

Fig 3

ID
ZDB-IMAGE-250620-8
Source
Figures for Ma et al., 2025
Image
Figure Caption

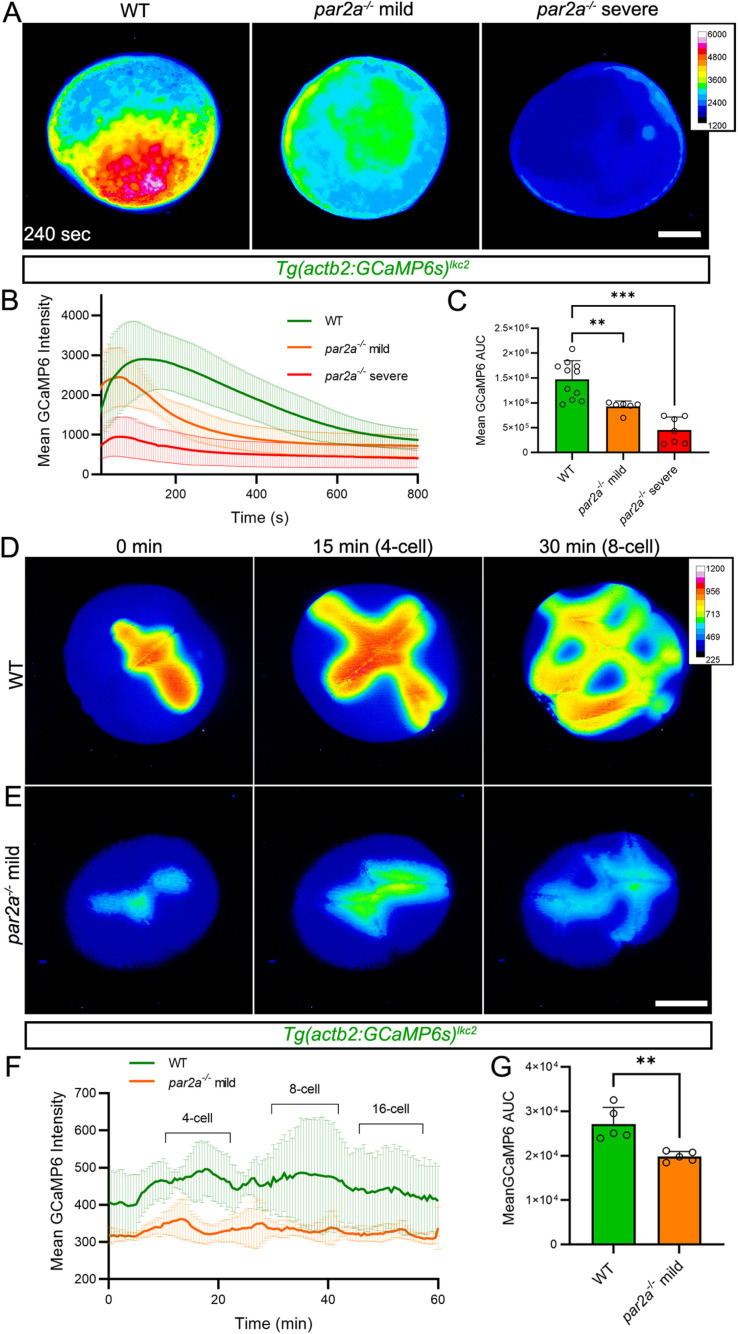
Fig 3 par2a mutants show defective Ca++ wave propagation during egg activation and blastomere cytokinesis.

A Normalized pseudo-coloured fluorescent images of Tg(actb2:GCaMP6s)lkc2 indicating comparative Ca++ levels at 240 s postegg activation in WT, mild and severe par2a mutant eggs. B: Changes in GCaMP6s intensity over 10 min from the Tg(actb2:GCaMP6s)lkc2 Ca++ reporter transgene of WT (green), mild par2a (yellow) and severe par2a (red) mutants following egg activation. C: Graph of corresponding Area Under Curve analysis of GCaMP6s levels presented in (B). n = 11,6,7; Mann–Whitney test; ** = P < 0.01; *** = p < 0.001. D, E: Projected light-sheet images of the animal pole of Tg(actb2:GCaMP6s)lkc2 in naturally fertilized WT (D) and mild par2a mutant eggs (E) during cell division over 30 min starting from 2-cell stage. F: Changes in GCaMP6s intensity over 1 h in WT (green) and mild par2a mutant embryos (yellow) during early blastomere division. Acquisition begins at 20 mpf and cell division events are indicated above WT by brackets. G: Graph of corresponding Area Under Curve analysis of GCaMP6s levels presented in (F). n = 5; Mann–Whitney test; ** = p < 0.01. Scale bars: A, E = 200 µm. See file S1 Data for underlying data.

Figure Data
Acknowledgments
This image is the copyrighted work of the attributed author or publisher, and ZFIN has permission only to display this image to its users. Additional permissions should be obtained from the applicable author or publisher of the image. Full text @ PLoS Biol.