
- Title
-
A Novel Role for Coilin in Vertebrate Innate Immunity
- Authors
- McLaurin, D.M., Tucker, S.K., Siddique, S.J., Challagundla, L., Gibert, Y., Hebert, M.D.
- Source
- Full text @ FASEB J.
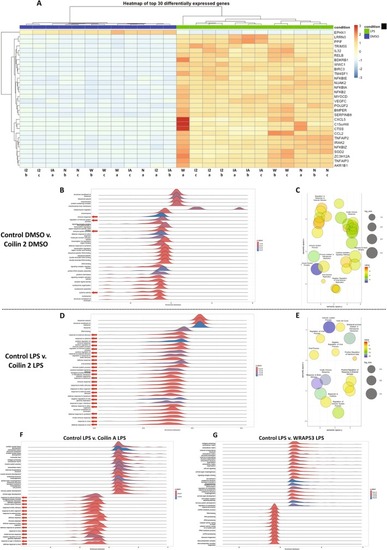
Human coilin positively contributes to the expression of innate immunity genes in HFF cells. (A) Heatmap of the top 30 differentially expressed genes for all KD and treatment (DMSO or LPS) conditions. Control KD indicated as N, coilin 2 KD indicated as I2, coilin A KD indicated as IA, and WRAP53 KD indicated as W. (B) GO analysis for the top differential expressed terms between control versus coilin 2 siRNA treated with DMSO. The red arrows denote terms related to the immune response. Peaks to the left of zero represent decreased expression whereas peaks to the right of zero are induced compared to control. (C) GO cluster analysis of differentially expressed immunity related GO terms for the control versus coilin 2 siRNA treated with DMSO comparison. (D) GO analysis for the top differential terms between control siRNA treated with LPS versus coilin 2 siRNA treated with LPS. The red arrows denote terms related to the innate immune response. (E) GO cluster analysis of differentially expressed genes between control siRNA treated with LPS and coilin 2 siRNA treated with LPS showing prominent clusters for innate immunity. (F) GO analysis for the top differential terms between control siRNA treated with LPS versus coilin A siRNA treated with LPS. The red arrows denote terms related to the innate immune response. (G) GO analysis for the top differential terms between control siRNA treated with LPS versus WRAP53 siRNA treated with LPS. |
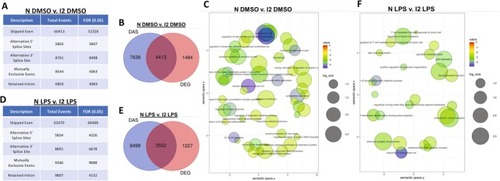
Coilin contributes to the innate immune response independent of splicing activity in HFF cells. (A) rMATS analysis for the control (N) versus coilin 2 (I2) KD treated with DMSO comparison. Five differentially alternatively spliced events were calculated with a false discovery rate (FDR) of 0.05. Compared to control (N), coilin (I2) KD increases all DAS classes. (B) An overlay of DAS genes with DEG genes for DMSO treated control (N) versus coilin (I2) KD. (C) DAS GO cluster analysis showing the top differentially expressed terms for the DMSO treated control (N) versus coilin (I2) KD comparison. (D) rMATS analysis for the control (N) versus coilin 2 (I2) KD treated with LPS comparison. Coilin (I2) KD increases all DAS classes compared to control (N). (E) An overlay of DAS genes with DEG genes for LPS treated control (N) versus coilin (I2) KD comparison. (F) DAS GO cluster analysis showing the top differentially expressed terms for the LPS treated control (N) versus coilin (I2) KD comparison. |
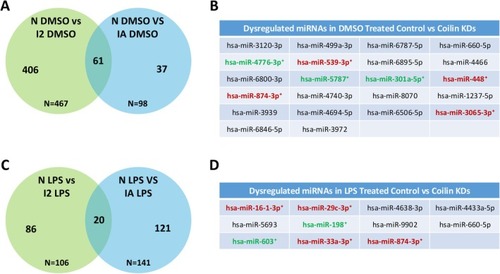
Coilin reduction alters the expression of miRNAs that contribute to the innate immune response. Small RNA seq analysis was conducted and miRNAs significantly dysregulated ( |
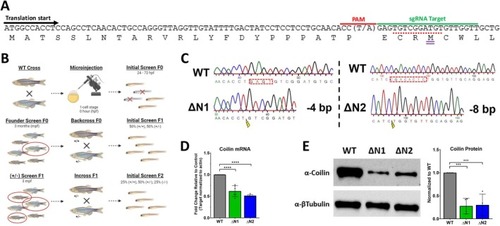
Generation of coilin N‐terminal (ΔN) mutants in zebrafish using CRISPR/Cas9. (A) Schematic of coilin's DNA and amino acid sequences showing the typical translational start site (black arrow), the PAM and sgRNA target sequences used to engineer CRISPR/Cas9 mutagenesis (red and green bars), and the alternative translation start (purple double bar) site lacking a Kozak sequence (red dash). The location of a SNP (A/T) corresponding to the N base of the NGG PAM sequence is shown. (B) Illustration of the development of homozygous |
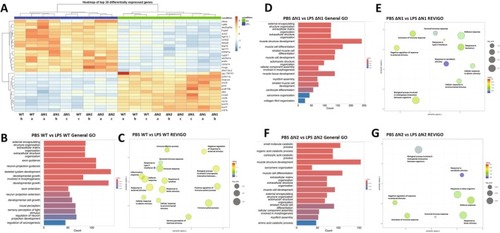
Coilin N‐terminal mutation impairs the activation of immunity‐related pathways. (A) Heatmap of the top 30 differentially expressed genes for WT and coilin mutant (ΔN1 and ΔN2) embryos injected with PBS (blue horizontal bar) or LPS (green horizontal bar). (B, D, F) GO enrichment analysis illustrating the top general pathways altered under PBS versus LPS comparisons in WT and mutants. (C, E, G) REVIGO analysis illustrating the top immunity‐related pathways altered under PBS versus LPS comparisons in WT and mutants. |

Coilin N‐terminal mutations similarly influence gene expression and predominately act independent of splicing events. (A, B) Venn diagrams illustrating the overlap in genes differentially expressed between ΔN1 and ΔN2 with WT upon PBS or LPS injection. (C, D) GO enrichment analysis illustrating the top general pathways altered under WT versus ΔN mutant comparisons under PBS or LPS injection. (E) Table highlighting a subset of genes found to be upregulated under PBS injection and downregulated under LPS injection in both ΔN mutants compared to WT. Boldened terms highlight immunity‐related genes. (F, H) rMATS analysis for the WT versus ΔN mutant comparisons under PBS or LPS injection. (G, I) Venn diagram showing the number of genes shared across DAS events and differential gene expression in the WT versus ΔN2 comparison under PBS or LPS injection. |
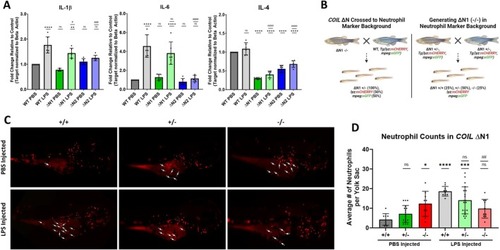
Coilin N‐terminal mutation impairs the immune response. (A) qPCR analysis of IL‐1β, IL‐6, and IL‐4 mRNA expression in 3 dpf WT or ΔN mutants injected with PBS or LPS. Data represents 3 biological replicates with 2 technical repeats for a total |