
|
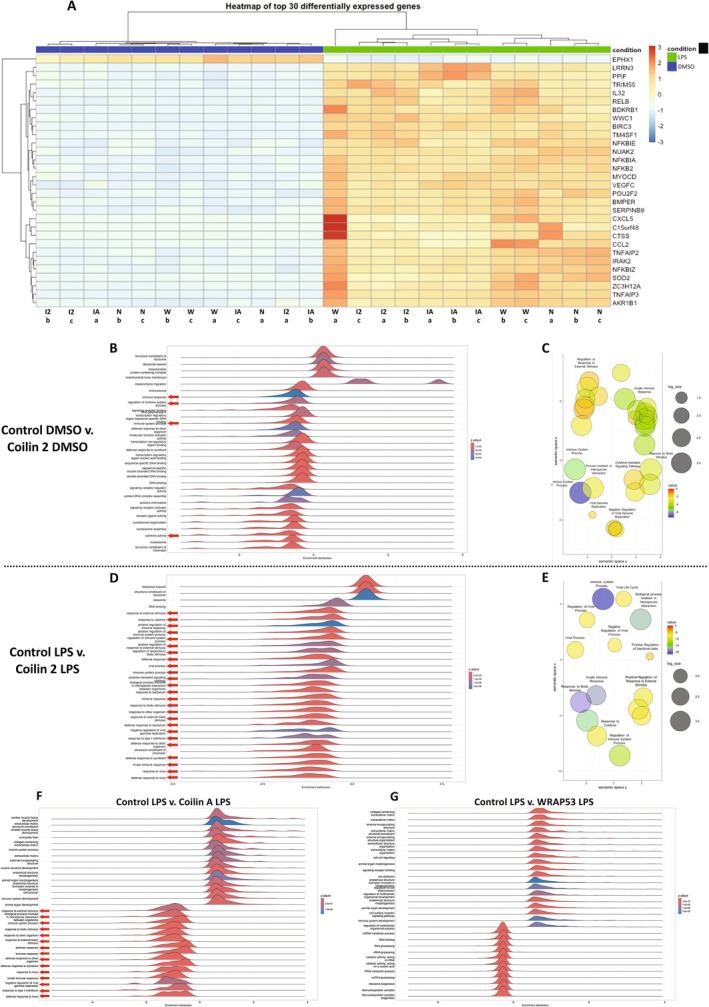
FIGURE 1
Human coilin positively contributes to the expression of innate immunity genes in HFF cells. (A) Heatmap of the top 30 differentially expressed genes for all KD and treatment (DMSO or LPS) conditions. Control KD indicated as N, coilin 2 KD indicated as I2, coilin A KD indicated as IA, and WRAP53 KD indicated as W. (B) GO analysis for the top differential expressed terms between control versus coilin 2 siRNA treated with DMSO. The red arrows denote terms related to the immune response. Peaks to the left of zero represent decreased expression whereas peaks to the right of zero are induced compared to control. (C) GO cluster analysis of differentially expressed immunity related GO terms for the control versus coilin 2 siRNA treated with DMSO comparison. (D) GO analysis for the top differential terms between control siRNA treated with LPS versus coilin 2 siRNA treated with LPS. The red arrows denote terms related to the innate immune response. (E) GO cluster analysis of differentially expressed genes between control siRNA treated with LPS and coilin 2 siRNA treated with LPS showing prominent clusters for innate immunity. (F) GO analysis for the top differential terms between control siRNA treated with LPS versus coilin A siRNA treated with LPS. The red arrows denote terms related to the innate immune response. (G) GO analysis for the top differential terms between control siRNA treated with LPS versus WRAP53 siRNA treated with LPS.