
- Title
-
Gene Identification for Ocular Congenital Cranial Motor Neuron Disorders Using Human Sequencing, Zebrafish Screening, and Protein Binding Microarrays
- Authors
- Jurgens, J.A., Matos Ruiz, P.M., King, J., Foster, E.E., Berube, L., Chan, W.M., Barry, B.J., Jeong, R., Rothman, E., Whitman, M.C., MacKinnon, S., Rivera-Quiles, C., Pratt, B.M., Easterbrooks, T., Mensching, F.M., Di Gioia, S.A., Pais, L., England, E.M., de Berardinis, T., Magli, A., Koc, F., Asakawa, K., Kawakami, K., O'Donnell-Luria, A., Hunter, D.G., Robson, C.D., Bulyk, M.L., Engle, E.C.
- Source
- Full text @ Invest. Ophthalmol. Vis. Sci.
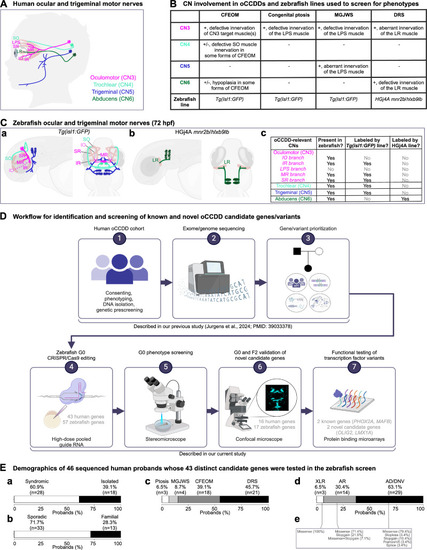
Human and zebrafish cranial motor nerves and study workflow. ( |
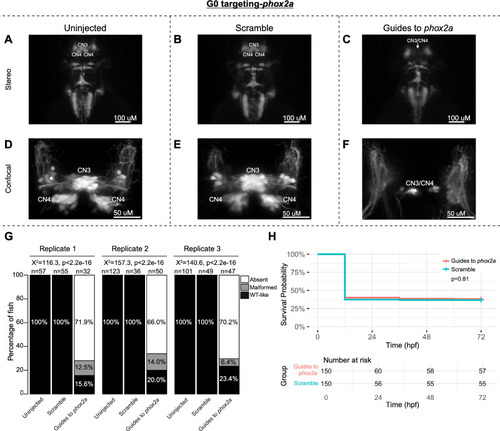
G0 zebrafish targeting of |
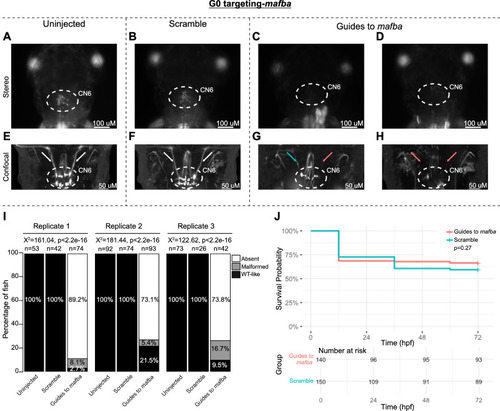
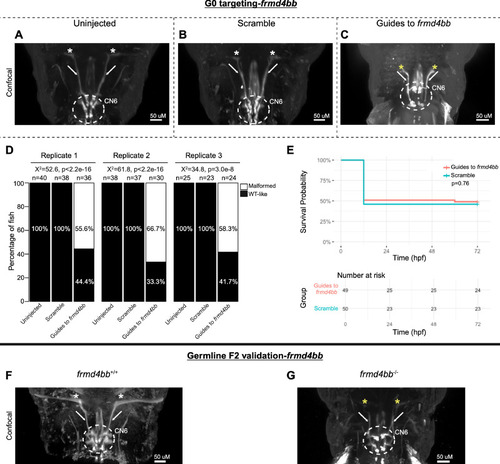
G0 zebrafish targeting of |
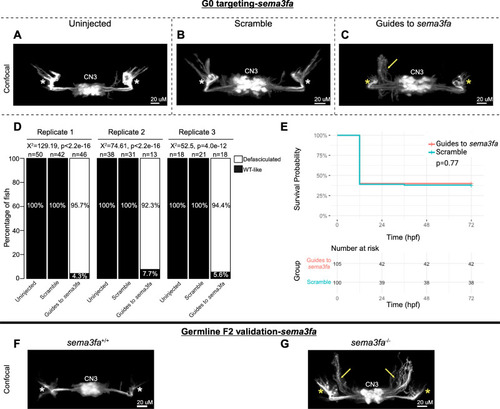
G0 mosaic and F2 germline zebrafish targeting of |
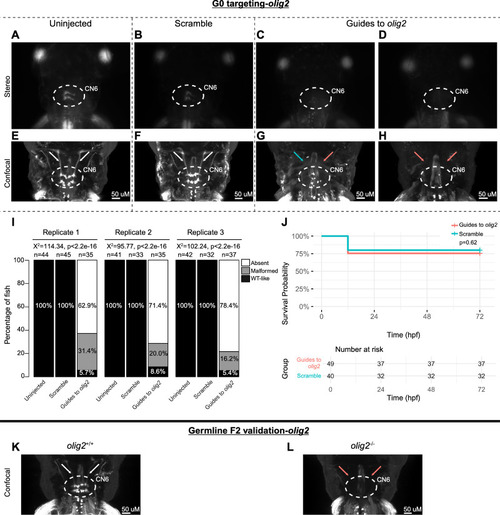
G0 mosaic and F2 germline zebrafish targeting of |
G0 mosaic and F2 germline zebrafish targeting of |
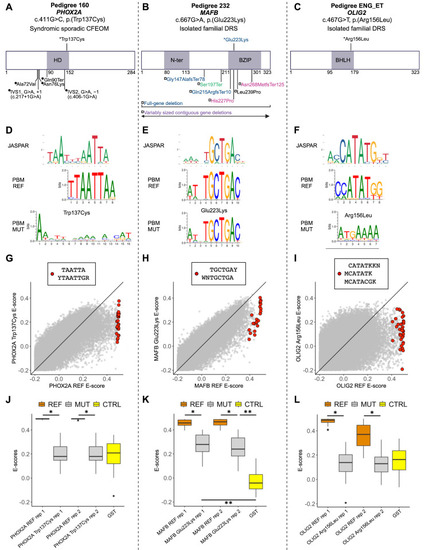
The oCCDD proband-derived candidate variants in transcription factors disrupt DNA binding. ( |
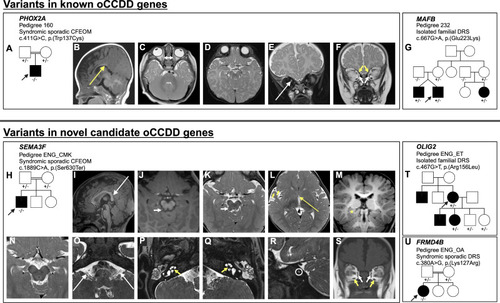
The oCCDD pedigrees with functionally validated candidate genes/variants and brain MR images of probands with homozygous |