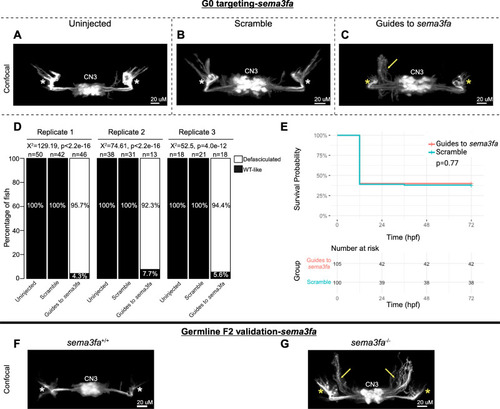
G0 mosaic and F2 germline zebrafish targeting of sema3fa. (A–E) Initial sema3fa targeting experiments were performed in G0 embryos. Representative images obtained by confocal microscopy (A–C) of uninjected (A), scrambled guide-injected (B), or sema3fa-targeting guide-injected (C) G0 Tg(isl1:GFP) zebrafish at 72 hpf. Note defasciculated CN3 (yellow arrow) and failed CN3 nerve extension toward extraocular muscles (yellow stars) relative to uninjected and scramble-injected CN3 (white stars). CN3, cranial nerve 3 (oculomotor); yellow arrow, increased defasciculation of CN3 nerve; yellow star, failed extension of CN3 nerve toward target extraocular muscles; white star, typical CN3 branches toward extraocular muscles. (D) Barplots showing the percentages of zebrafish exhibiting wild-type-like (WT-like) or defasciculated CN3 nerve(s), as scored under the dissecting stereomicroscope in G0 zebrafish at 72 hpf. Total numbers of fish in each group are given above the corresponding bar. Data are shown from three experimental replicates. Pearson's 2 × 3 χ2 test with 2 degrees of freedom; for each of three experimental replicates, χ2 = 129.19, P < 2.2e−16; χ2 = 74.61, P < 2.2e−16; χ2 = 52.5, P = 4.0e−12. (E) Kaplan-Meier survival curves demonstrating the relative survival probabilities of scramble-injected (blue line) and guide-injected (pink line) zebrafish over the first 72 hours of life. Number at risk below the plot provides the counts of surviving embryos in each group taken every 24 hpf over a 72 hpf period. Relative survival probabilities of sema3fa-targeting and scrambled gRNA-injected embryos were compared by the log-rank test. Displayed data were derived from a single experimental replicate, but measurements were taken for three experimental replicates, all of which showed the same trend. (F, G) Representative images from wild-type or F2 germline sema3fa−/− (c.869_873delTGAGA, p.(Glu290GlyfsTer8)) mutants (arrows and stars as per A–C).
|
