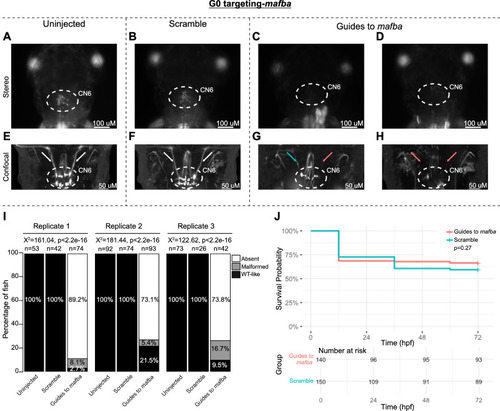
G0 zebrafish targeting of mafba. (A–H) Representative images obtained by stereomicroscope (A–D) and confocal microscopy (E–H) of uninjected (A, E), scrambled guide-injected (B, F), or mafba-targeting guide-injected (C, D, G, H) G0 HGj4A zebrafish at 72 hpf. Two images are provided for guide-injected fish, demonstrating variability in G0 targeting outcomes. Stereomicroscope images for each treatment group correspond to the confocal images obtained from the same fish in the panel below. Motor neurons in the abducens nucleus (dashed white circled region) appear absent by stereomicroscopy (C, D) or variably reduced (G, H) by confocal microscopy, and abducens nerves appear thin (G;blue arrow) or absent (G, H;red arrows) compared to normal (E, F; white arrows) by confocal microscopy. (I) Barplots showing the percentages of zebrafish exhibiting wild-type-like (WT-like), malformed, or absent CN6 motor neuron nuclei, as scored under the dissecting stereomicroscope in G0 zebrafish at 72 hpf. Total numbers of fish in each group are given above the corresponding bar. Data are shown from three experimental replicates. Pearson's 3 × 3 χ2 test with 4 degrees of freedom; P values and χ2 values provided for each replicate. (J) Kaplan-Meier survival curves demonstrating the relative survival probabilities of scramble-injected (blue line) and guide-injected (pink line) zebrafish over the first 72 hours of life. Number at risk below the plot provides the counts of surviving embryos in each group taken every 24 hpf over a 72 hpf period. Relative survival probabilities of mafba-targeting guide-injected and scrambled-injected embryos were compared by the log-rank test. Displayed data were derived from a single experimental replicate, but measurements were taken for three experimental replicates, all of which showed the same trend.
|
