
- Title
-
Dynactin knockdown leads to synuclein aggregation by blocking autophagy in a zebrafish model of Parkinson's disease
- Authors
- Wu, Y., Guo, Q., Gan, J., Duan, L., Zhao, H., Tai, H., Yang, C., Li, Y., Xu, Z., Yao, Y., Nie, Z., Yang, M., Li, S., Li, J., Su, B.
- Source
- Full text @ Braz. J. Med. Biol. Res.
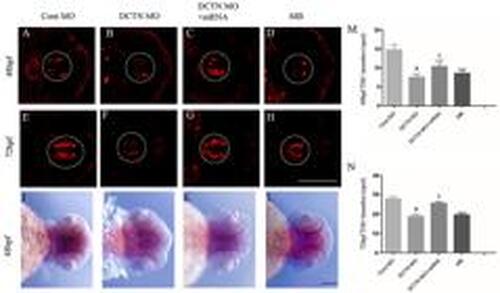
Knockdown of the dynactin gene led to a decrease of dopaminergic neurons in the diencephalon. Immunofluorescence was used to observe the changes of tyrosine hydroxylase (TH)-positive neurons in the diencephalon of zebrafish at 48 and 72 hpf. A and E, Control MO group; B and F, DCTN MO group; C and G, DCTN MO+mRNA group; D and H, MB group. Scale bar, 100 μm. Expression of TH in the diencephalon of zebrafish was detected at 48 hpf by in situ hybridization. I, Control MO group; J, DCTN MO group; K, DCTN MO+mRNA group; L, MB group. The white and black dotted lines indicate the ventral area of the zebrafish diencephalon. Scale bar, 200 μm. M and N, Number of TH-positive neurons in zebrafish diencephalon at 48 and 72 hpf. Data are reported as means±SD. aP<0.0001, compared with the Cont MO group; bP<0.05, compared with the DCTN MO group (two-way ANOVA, Tukey post hoc, n=15-30 zebrafish per group). Cont MO: control morpholino; DCTN MO: dynactin morpholino; DCTN MO+mRNA: dynactin morpholino+dynactin mRNA; MB: mycalolide B. |
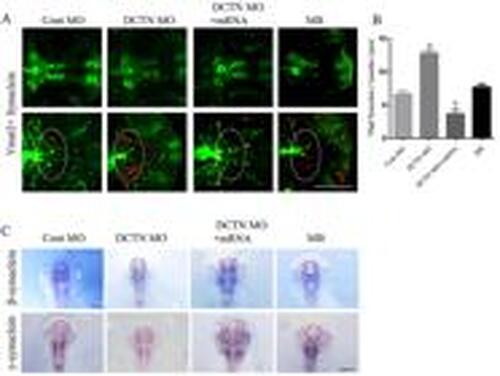
Synuclein aggregation increased in the basal plate region after dynactin knockdown. A, Synuclein antibody and Tg (Vmat2:GFP) transgenic zebrafish were co-labeled to detect synuclein protein at 72 hpf . The red staining shows synuclein protein, and the green staining shows Tg (Vmat2:GFP) transgenic zebrafish. The white dotted line indicates the basal plate of zebrafish. Scale bar, 100 μm. B, Number of synuclein-positive spots in zebrafish basal plate region at 72 hpf. C, Expression of β-synuclein and γ-synuclein in the ventral diencephalon of zebrafish was detected by in situ hybridization. The black dotted line indicates the ventral diencephalon of zebrafish. Scale bar, 200 μm. Data are reported as means±SD. aP<0.0001, compared with the Cont MO group; bP<0.0001, compared with the DCTN MO group (two-way ANOVA, Tukey post hoc, n=15-30 zebrafish per group). Cont MO: control morpholino; DCTN MO: dynactin morpholino; DCTN MO+mRNA: dynactin morpholino+dynactin mRNA; MB: mycalolide B. |
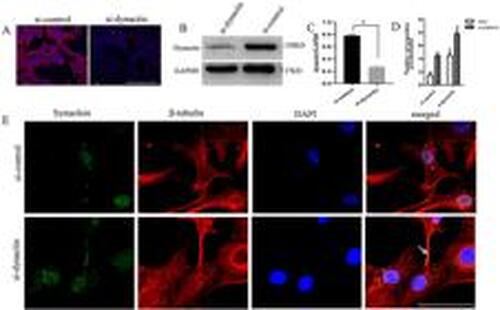
Dynactin knockdown resulted in synuclein aggregation in SH-SY5Y cells. A, Expression of dynactin protein in SH-SY5Y cells from the control group (si-control) and the dynactin siRNA group (si-dynactin) was detected by immunofluorescence. The red staining shows the dynactin protein, and the blue staining shows the DAPI stained nuclei. Scale bar, 100 μm. B, Expression of dynactin in SH-SY5Y cells was detected by western blotting. C, Quantification of dynactin to GAPDH shown in panel B. D, Number of synuclein accumulated in axons and cytoplasm. E, Synuclein and β-tubulin antibodies were co-labeled to detect the expression of synuclein in SH-SY5Y cells from the si-control and si-dynactin groups. The green staining shows the synuclein protein, the red staining shows the β-tubulin protein, and the blue staining shows the DAPI stained nucleus. The arrow indicates the aggregated synuclein protein. Scale bar, 50 μm. Data are reported as means±SD. aP<0.0001, compared with the si-control group (Student's t-test, n=3 biological replicates). |
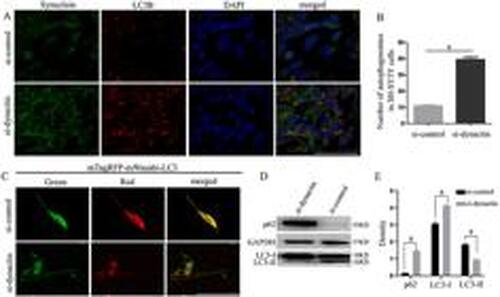
After dynactin knockdown, the autophagosomes formed by synuclein increased abnormally through a blocking pathway. A, Co-labeling of synuclein and LC3B proteins in the si-control and si-dynactin groups was detected in SH-SY5Y cells. Green staining represents synuclein protein, red staining represents LC3B protein, and blue staining represents DAPI-stained nuclei. Scale bar, 100 μm. B, Number of autophagosomes in SH-SY5Y cells. aP<0.0001, compared with the si-control group (t=17.52, df=10). C, Autophagy flow in SH-SY5Y cells in the si-control and si-dynactin groups was detected using the mTagRFP-mWasabi-LC3 plasmid. Scale bar, 50 μm. D, Expression of LC3 and p62 proteins in SH-SY5Y cells was detected by western blot. E, Quantification of p62, LC3-I, and LC3-II relative to GAPDH in panel D. Data are reported as means±SD. aP<0.0001, compared with the si-control group (Student's t-test, n=3 biological replicates). |
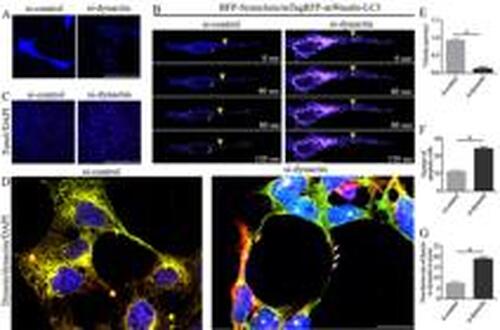
Knockdown of dynactin resulted in the inhibition of synuclein autophagosome transport in SH-SY5Y cell axons. A, Expression changes of BFP-Synuclein protein in the si-control and si-dynactin groups. The blue color represents synuclein protein. Scale bar, 50 μm. B, The mTagRFP-mWasabi-LC3 plasmid was transiently transfected into SH-SY5Y/pCMV-C-BFP-α-Synuclein cells to detect the transport of synuclein autophagosomes in the axons of the si-control and si-dynactin groups. The blue color represents synuclein protein, and the purple color indicates co-labeling of synuclein and LC3 proteins. Scale bar, 50 μm. C, Apoptosis in the si-control and si-dynactin groups was detected by TUNEL assay. The red color represents TUNEL staining, and the blue color represents DAPI staining. Scale bar, 100 μm. D, Dynein (red) and dynactin (green) were co-labeled in the si-control and si-dynactin groups. Scale bar, 50 μm. E, Average velocities of retrograde synuclein autophagosomes. F, Number of apoptotic SH-SY5Y cells. G, Non-fusion rate of dynein and dynactin in axons. Arrows: Dynein and dynactin are not co-labeled in the axonal processes. Data are reported as means±SD. aP<0.001 and bP<0.0001 compared with the si-control group (Student's t-test, n=3 biological replicates). |