
|
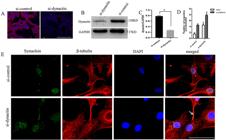
Fig. 3 Dynactin knockdown resulted in synuclein aggregation in SH-SY5Y cells. A, Expression of dynactin protein in SH-SY5Y cells from the control group (si-control) and the dynactin siRNA group (si-dynactin) was detected by immunofluorescence. The red staining shows the dynactin protein, and the blue staining shows the DAPI stained nuclei. Scale bar, 100 μm. B, Expression of dynactin in SH-SY5Y cells was detected by western blotting. C, Quantification of dynactin to GAPDH shown in panel B. D, Number of synuclein accumulated in axons and cytoplasm. E, Synuclein and β-tubulin antibodies were co-labeled to detect the expression of synuclein in SH-SY5Y cells from the si-control and si-dynactin groups. The green staining shows the synuclein protein, the red staining shows the β-tubulin protein, and the blue staining shows the DAPI stained nucleus. The arrow indicates the aggregated synuclein protein. Scale bar, 50 μm. Data are reported as means±SD. aP<0.0001, compared with the si-control group (Student's t-test, n=3 biological replicates).