
Fig. 5
- ID
- ZDB-FIG-250430-10
- Publication
- Wu et al., 2025 - Dynactin knockdown leads to synuclein aggregation by blocking autophagy in a zebrafish model of Parkinson's disease
- Other Figures
- All Figure Page
- Back to All Figure Page
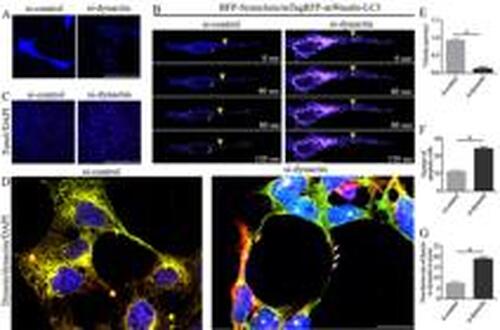
Knockdown of dynactin resulted in the inhibition of synuclein autophagosome transport in SH-SY5Y cell axons. A, Expression changes of BFP-Synuclein protein in the si-control and si-dynactin groups. The blue color represents synuclein protein. Scale bar, 50 μm. B, The mTagRFP-mWasabi-LC3 plasmid was transiently transfected into SH-SY5Y/pCMV-C-BFP-α-Synuclein cells to detect the transport of synuclein autophagosomes in the axons of the si-control and si-dynactin groups. The blue color represents synuclein protein, and the purple color indicates co-labeling of synuclein and LC3 proteins. Scale bar, 50 μm. C, Apoptosis in the si-control and si-dynactin groups was detected by TUNEL assay. The red color represents TUNEL staining, and the blue color represents DAPI staining. Scale bar, 100 μm. D, Dynein (red) and dynactin (green) were co-labeled in the si-control and si-dynactin groups. Scale bar, 50 μm. E, Average velocities of retrograde synuclein autophagosomes. F, Number of apoptotic SH-SY5Y cells. G, Non-fusion rate of dynein and dynactin in axons. Arrows: Dynein and dynactin are not co-labeled in the axonal processes. Data are reported as means±SD. aP<0.001 and bP<0.0001 compared with the si-control group (Student's t-test, n=3 biological replicates). |