
|
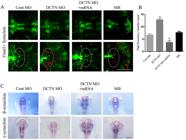
Fig. 2 Synuclein aggregation increased in the basal plate region after dynactin knockdown. A, Synuclein antibody and Tg (Vmat2:GFP) transgenic zebrafish were co-labeled to detect synuclein protein at 72 hpf . The red staining shows synuclein protein, and the green staining shows Tg (Vmat2:GFP) transgenic zebrafish. The white dotted line indicates the basal plate of zebrafish. Scale bar, 100 μm. B, Number of synuclein-positive spots in zebrafish basal plate region at 72 hpf. C, Expression of β-synuclein and γ-synuclein in the ventral diencephalon of zebrafish was detected by in situ hybridization. The black dotted line indicates the ventral diencephalon of zebrafish. Scale bar, 200 μm. Data are reported as means±SD. aP<0.0001, compared with the Cont MO group; bP<0.0001, compared with the DCTN MO group (two-way ANOVA, Tukey post hoc, n=15-30 zebrafish per group). Cont MO: control morpholino; DCTN MO: dynactin morpholino; DCTN MO+mRNA: dynactin morpholino+dynactin mRNA; MB: mycalolide B.