FIGURE SUMMARY
Title

Tyrosyl-DNA phosphodiesterase 1 (TDP1) and SPRTN protease repair histone 3 and topoisomerase 1 DNA-protein crosslinks in vivo

Authors
Anticevic, I., Otten, C., Vinkovic, L., Jukic, L., Popovic, M.
Source
Full text @ Open Biol.

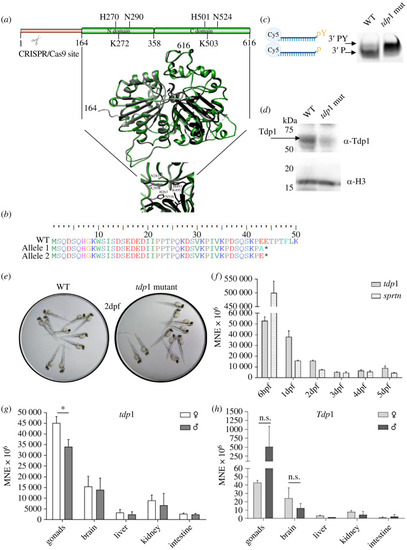
Structural comparison of zebrafish and human TDP1, validation and characterization of the zebrafish tdp1 mutant line, and tdp1 expression profiles in zebrafish embryos and zebrafish and mouse tissues. (a) The zebrafish Tdp1 structural model (in green) is overlapped with the human TDP1 crystal structure (PDB: 1jy1) [44], shown in grey (N domain) and black (C domain). Zebrafish Tdp1 was modelled using the Phyre2 workspace [42] according to the human TDP1 (PDB: c1nopB). N domain and C domain form a pseudo-2-fold axis of symmetry where each domain contributes to the active site: H263, K265 and N283 in the N domain and H493, K495 and N516 in the C domain. (b) Amino acid sequence of Tdp1 in tdp1 mutant fish line: frameshift and introduction of a premature stop codon in tdp1 mutant fish line is deduced from DNA sequencing (*, premature STOP). (c) TDP1 activity assay performed with 600 ng of lysate from 2-dpf WT and tdp1 mutant embryos. Left panel: scheme created with BioRender.com of TDP1 substrate oligonucleotide with tyrosine (pY) on 3′ end and Cy5 fluorescent reporter on 5′ end and a reaction product after TDP1-mediated removal of tyrosine (p); right panel: TDP1 activity assay reactions resolved on 20% homemade urea gel and visualized using the ChemiDoc MP Imaging System to detect Cy5 fluorescence. (d) Western blot using a custom antibody against zebrafish Tdp1 shows the absence of a specific Tdp1 signal (68 kDa, indicated by arrow) in tdp1 mutant embryo lysate. Histone H3 was used as a loading control. (e) Images of WT and tdp1 mutant embryos (2 dpf, 2 days post fertilization). Embryos were maintained in E3 media, placed on a lid of a 96-well culture plate, and visualized with stereo microscope (Motic-SMZ-171-TP). Images were captured using a Canon 250D DSLR camera. (f) Tdp1 and sprtn expression patterns during the embryonic development from 6 h post fertilization (6 hpf) to 5 days post fertilization (5 dpf). Data represent MNE (mean normalized expression) ± s.d. (n = 3) normalized to the housekeeping gene atp50. (g) Tissue expression pattern of tdp1 in male and female zebrafish, with statistically significant differences between expression in ovaries and testes (*p < 0.05) determined by unpaired t-test. Data are presented as MNE (mean normalized expression) ± s.d. (n = 3) normalized to the housekeeping gene atp50. (h) Tissue expression pattern of Tdp1 in male and female mice (n.s., non significant, p > 0.05). Data represent MNE (mean normalized expression) ± s.d. (n = 3) normalized to the housekeeping gene Atp50.

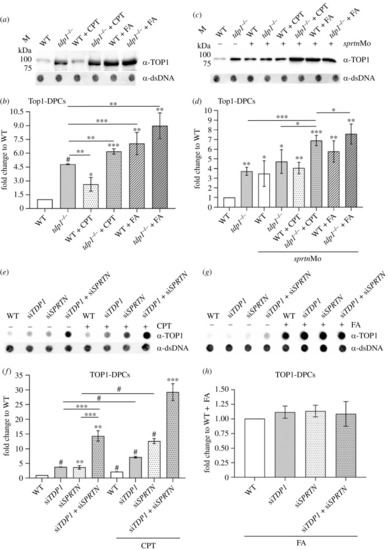
Tdp1 deficiency causes strong accumulation of endogenous and chemically induced Top1-DPCs in embryos and cells. (a) Western blot showing zebrafish Top1-DPCs in tdp1 mutant embryos before and after camptothecin (CPT) (10 µM, 1 h) and formaldehyde (FA) treatment (5 mM, 30 min) (DPC equivalent of 1 µg DNA was loaded per well) and (b) corresponding quantification (n = 4). (c) Western blot showing zebrafish Top1-DPCs in tdp1 mutant embryos before and after sprtn silencing and CPT (10 µM, 1 h) and FA treatment (5 mM, 30 min) and (d) corresponding quantification. (e) Dot blots showing human TOP1-DPCs detected with TOP1-specific antibody before and after CPT treatment of RPE1 cells (50 nM, 1 h) with corresponding DNA loading controls (DPC equivalent of 500 ng DNA was loaded per well). (f) Quantification of (e) from three different biological replicates normalized to untreated WT cells. (g) Dot blots showing human TOP1-DPCs detected with TOP1-specific antibody before and after FA treatment of RPE1 cells (1 mM, 20 min) with corresponding DNA loading controls (DPC equivalent of 500 ng DNA was loaded per well). (h) Quantification of (g) (n = 3). Results represent mean fold change ± s.d. of three different experiments. Statistically significant changes as a result from unpaired Student's t-test are shown as *p < 0.05, **p < 0.01, ***p < 0.001 or #p < 0.0001.

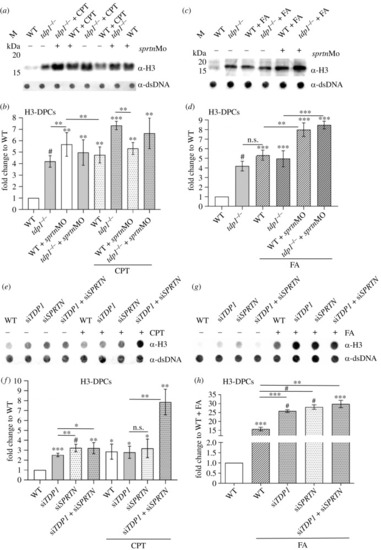
H3-DPC levels are increased
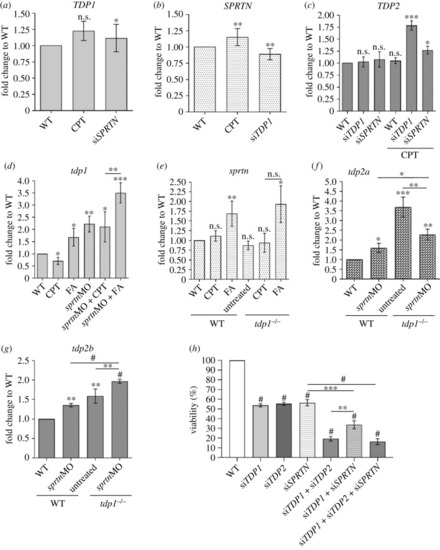
 in vivo in tdp1 mutant fish line and in RPE1 cells with TDP1 deficiency. (a) Western blot showing H3-DPC levels in tdp1 mutant embryos in combination with sprtn knockdown and CPT (10 µM, 1 h) treatment. Total DPCs were isolated from 2-day-old embryos, separated by SDS–PAGE (DPC equivalent of 200 ng DNA per well) and detected with H3-specific antibody. (b) Quantifications of H3-DPCs from four biological replicates with mean (± s.d.) fold change to endogenous H3-DPCs in WT embryos. (c) Western blot analysis of H3-DPCs in zebrafish embryos and (d) corresponding quantification after FA treatment (5 mM for 30 min) (n = 4). (e) Dot blots showing H3-DPCs after silencing TDP1 and/or SPRTN before and after CPT exposure in RPE1 cells (50 nM CPT, 1 h) and DNA loading controls. Equivalent of 200 ng DNA of total DPCs was loaded per sample. (f) Quantification of H3-DPC analysis in RPE1 cells (n = 3). (g) Dot blots showing H3-DPCs after silencing TDP1 and/or SPRTN before and after FA exposure (1 mM FA, 20 min) in RPE1 cells and DNA loading controls and (h) corresponding quantification (n = 3). Results are presented as mean ± s.d. with statistically significant changes, determined using an unpaired Student's t-test, indicated with *p < 0.05, **p < 0.01, ***p < 0.001 and #p < 0.0001.

Effects of TDP1 and SPRTN deficiency on TDP1, SPRTN and TDP2 mRNA expression levels in RPE1 cells and zebrafish embryos and decrease of cell viability. (a) Expression levels of TDP1 in RPE1 cells after SPRTN silencing and CPT exposure (50 nM, 1 h). (b) SPRTN levels decrease after TDP1 silencing in CPT-treated RPE1 cells. (c) TDP2 significantly increases after TDP1 silencing in CPT-treated RPE1 cells. (d) Zebrafish tdp1 expression levels significantly increase in embryos after sprtn knockdown. (e) Sprtn expression in WT and tdp1 mutant embryos before and after CPT (10 µM, 1 h) and FA (1 mM, 20 min) treatment. (f) Tdp2a expression is significantly increased in tdp1 mutants before and after sprtn silencing and in WTs after sprtn silencing. (g) Tdp2b expression significantly increases in tdp1 mutants before and after sprtn silencing and in WTs after sprtn silencing. Results are presented as fold changes to WT (mean ± s.d.) from four biological replicates. (h) MTT viability assay after TDP1, SPRTN and TDP2 gene silencing. All measurements were normalized to WT from three different experiments. Corresponding silencing efficiencies are shown in electronic supplementary material, figure S3 (mean ± s.d.; n = 3 independent experiments). Unpaired t-tests were performed with GraphPad Prism, with significance shown as *p < 0.05, **p < 0.01, ***p < 0.001 or #p < 0.0001.

DPC analysis in Tdp1 and Sprtn deficient embryos under physiological conditions and after CPT (10 µM, 1 h) and FA (5 mM, 30 min) treatment. (a) DPCs were isolated from 2 dpf embryos using the RADAR assay (30 embryos per condition, n = 4), resolved on the SDS acrylamide gel, and stained with silver (left panel-low exposure; right panel-high exposure). Dot blots showing DNA loading controls for DPC analysis prior to benzonase treatment are shown below (DPC equivalent of 200 ng of total DNA was loaded per well). (b) Quantification of (a). Quantifications of LMW DPCs (protein size less than 40 kDa) (c), MMW DPCs (40–150 kDa) (d) and HMW (greater than 150 kDa) (e) from (a). Data represent mean fold change to WT ± s.d. (n = 4). Statistical significance was established using an unpaired Student's t-test (*p < 0.05, **p < 0.01, ***p < 0.001 and #p < 0.0001).

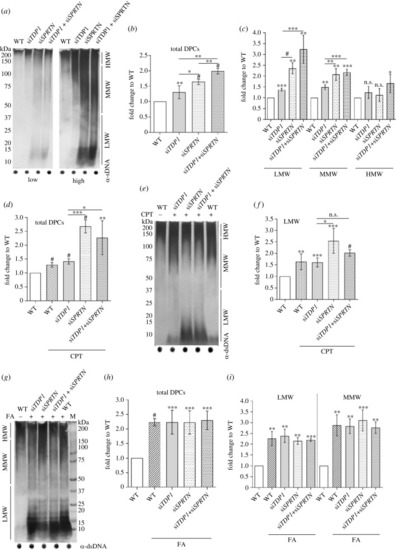
DPC analysis in RPE1 cells after TDP1 and SPRTN gene silencing and after CPT (50 nM, 1 h) and FA (1 mM, 20 min) treatment. Silencing was carried out for 72 h prior to collection, and the efficiency of each condition was confirmed using qPCR (electronic supplementary material, figure S2c). (a) DPC isolates from untreated cells resolved on the SDS acrylamide gel, and stained with silver (left panel-low exposure; right panel-high exposure). Dot blots showing DNA loading controls are shown below. (b) Quantification of (a). (c) Quantification of LMW, MMW and HMW DPCs from (a) normalized to non-treated WT cells from four independent experiments (n = 4). (d) Quantification of (e) (n = 3). (e) DPC isolates from CPT-treated cells resolved on the SDS acrylamide gel and stained with corresponding DNA loading controls shown below. (f) LMW DPCs (quantification from (d)). (g) DPC isolates from FA-treated cells resolved on the SDS acrylamide gel and stained with silver with corresponding DNA loading controls. (h) Quantification of (g) (n = 3). (i) LMW and MMW DPC levels quantified from (g), a DPC equivalent of 200 ng total DNA was loaded per condition. All conditions were normalized to WT and statistical analysis was performed with GraphPad Prism software using an unpaired t-test (*p < 0.05, **p < 0.01, ***p < 0.001 or #p < 0.0001).

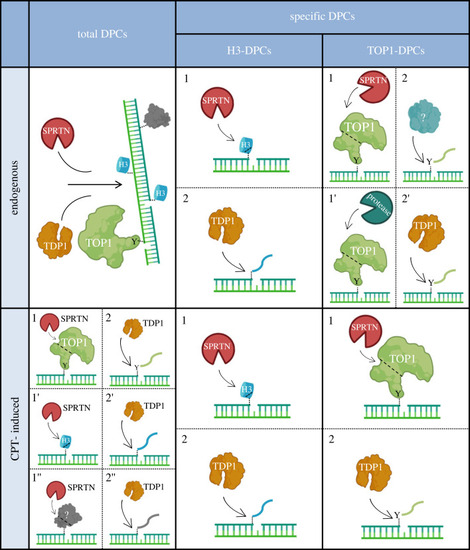
Model of coordinated action of SPRTN and TDP1 in DNA–protein crosslink repair in human cells and zebrafish model. SPRTN is a general DPC protease that cleaves a wide spectrum of crosslinked proteins, whereas TDP1 removes protein residues bound to the 3′ end of the ssDNA break. Under physiological conditions, these two proteins function independently to resolve total DPCs, including specific TOP1-DPCs. Importantly, resolution of endogenous histone-DPCs originating at abasic (AP) sites depends on SPRTN-mediated proteolysis followed by TDP1 phosphodiesterase activity, by which the crosslinked peptide residue is removed from the DNA backbone. In response to the DNA-damaging agent camptothecin, an epistatic relationship between SPRTN and TDP1 is required for the successful removal of histones and TOP1-DPCs as well as other DPCs at the 3′ ends of ssDNA breaks. The model was created with BioRender.com.

Acknowledgments
This image is the copyrighted work of the attributed author or publisher, and ZFIN has permission only to display this image to its users. Additional permissions should be obtained from the applicable author or publisher of the image. Full text @ Open Biol.