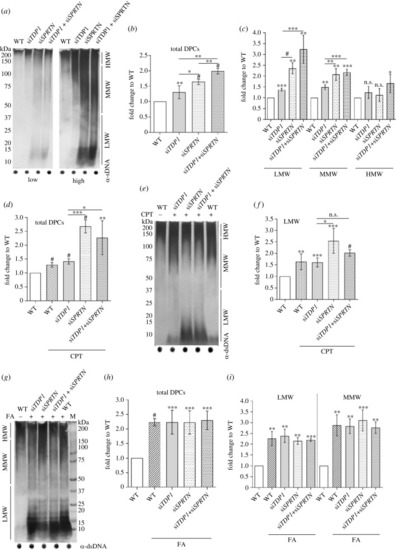
DPC analysis in RPE1 cells after TDP1 and SPRTN gene silencing and after CPT (50 nM, 1 h) and FA (1 mM, 20 min) treatment. Silencing was carried out for 72 h prior to collection, and the efficiency of each condition was confirmed using qPCR (electronic supplementary material, figure S2c). (a) DPC isolates from untreated cells resolved on the SDS acrylamide gel, and stained with silver (left panel-low exposure; right panel-high exposure). Dot blots showing DNA loading controls are shown below. (b) Quantification of (a). (c) Quantification of LMW, MMW and HMW DPCs from (a) normalized to non-treated WT cells from four independent experiments (n = 4). (d) Quantification of (e) (n = 3). (e) DPC isolates from CPT-treated cells resolved on the SDS acrylamide gel and stained with corresponding DNA loading controls shown below. (f) LMW DPCs (quantification from (d)). (g) DPC isolates from FA-treated cells resolved on the SDS acrylamide gel and stained with silver with corresponding DNA loading controls. (h) Quantification of (g) (n = 3). (i) LMW and MMW DPC levels quantified from (g), a DPC equivalent of 200 ng total DNA was loaded per condition. All conditions were normalized to WT and statistical analysis was performed with GraphPad Prism software using an unpaired t-test (*p < 0.05, **p < 0.01, ***p < 0.001 or #p < 0.0001).
|
