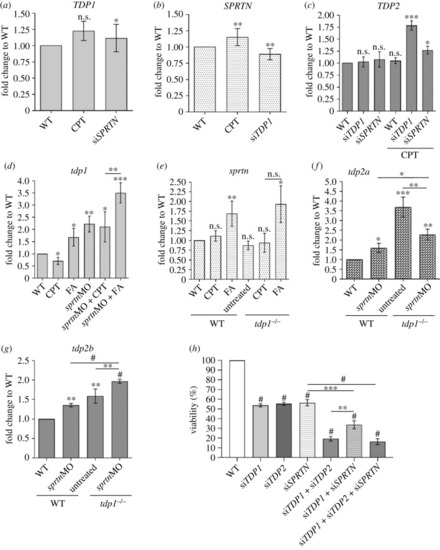
Effects of TDP1 and SPRTN deficiency on TDP1, SPRTN and TDP2 mRNA expression levels in RPE1 cells and zebrafish embryos and decrease of cell viability. (a) Expression levels of TDP1 in RPE1 cells after SPRTN silencing and CPT exposure (50 nM, 1 h). (b) SPRTN levels decrease after TDP1 silencing in CPT-treated RPE1 cells. (c) TDP2 significantly increases after TDP1 silencing in CPT-treated RPE1 cells. (d) Zebrafish tdp1 expression levels significantly increase in embryos after sprtn knockdown. (e) Sprtn expression in WT and tdp1 mutant embryos before and after CPT (10 µM, 1 h) and FA (1 mM, 20 min) treatment. (f) Tdp2a expression is significantly increased in tdp1 mutants before and after sprtn silencing and in WTs after sprtn silencing. (g) Tdp2b expression significantly increases in tdp1 mutants before and after sprtn silencing and in WTs after sprtn silencing. Results are presented as fold changes to WT (mean ± s.d.) from four biological replicates. (h) MTT viability assay after TDP1, SPRTN and TDP2 gene silencing. All measurements were normalized to WT from three different experiments. Corresponding silencing efficiencies are shown in electronic supplementary material, figure S3 (mean ± s.d.; n = 3 independent experiments). Unpaired t-tests were performed with GraphPad Prism, with significance shown as *p < 0.05, **p < 0.01, ***p < 0.001 or #p < 0.0001.
|
