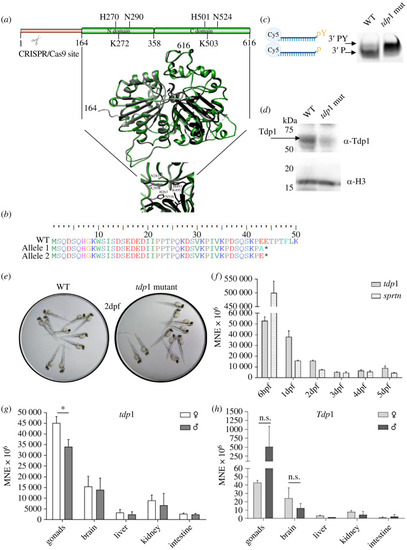
Structural comparison of zebrafish and human TDP1, validation and characterization of the zebrafish tdp1 mutant line, and tdp1 expression profiles in zebrafish embryos and zebrafish and mouse tissues. (a) The zebrafish Tdp1 structural model (in green) is overlapped with the human TDP1 crystal structure (PDB: 1jy1) [44], shown in grey (N domain) and black (C domain). Zebrafish Tdp1 was modelled using the Phyre2 workspace [42] according to the human TDP1 (PDB: c1nopB). N domain and C domain form a pseudo-2-fold axis of symmetry where each domain contributes to the active site: H263, K265 and N283 in the N domain and H493, K495 and N516 in the C domain. (b) Amino acid sequence of Tdp1 in tdp1 mutant fish line: frameshift and introduction of a premature stop codon in tdp1 mutant fish line is deduced from DNA sequencing (*, premature STOP). (c) TDP1 activity assay performed with 600 ng of lysate from 2-dpf WT and tdp1 mutant embryos. Left panel: scheme created with BioRender.com of TDP1 substrate oligonucleotide with tyrosine (pY) on 3′ end and Cy5 fluorescent reporter on 5′ end and a reaction product after TDP1-mediated removal of tyrosine (p); right panel: TDP1 activity assay reactions resolved on 20% homemade urea gel and visualized using the ChemiDoc MP Imaging System to detect Cy5 fluorescence. (d) Western blot using a custom antibody against zebrafish Tdp1 shows the absence of a specific Tdp1 signal (68 kDa, indicated by arrow) in tdp1 mutant embryo lysate. Histone H3 was used as a loading control. (e) Images of WT and tdp1 mutant embryos (2 dpf, 2 days post fertilization). Embryos were maintained in E3 media, placed on a lid of a 96-well culture plate, and visualized with stereo microscope (Motic-SMZ-171-TP). Images were captured using a Canon 250D DSLR camera. (f) Tdp1 and sprtn expression patterns during the embryonic development from 6 h post fertilization (6 hpf) to 5 days post fertilization (5 dpf). Data represent MNE (mean normalized expression) ± s.d. (n = 3) normalized to the housekeeping gene atp50. (g) Tissue expression pattern of tdp1 in male and female zebrafish, with statistically significant differences between expression in ovaries and testes (*p < 0.05) determined by unpaired t-test. Data are presented as MNE (mean normalized expression) ± s.d. (n = 3) normalized to the housekeeping gene atp50. (h) Tissue expression pattern of Tdp1 in male and female mice (n.s., non significant, p > 0.05). Data represent MNE (mean normalized expression) ± s.d. (n = 3) normalized to the housekeeping gene Atp50.
|
