
- Title
-
HDAC6 promotes growth, migration/invasion, and self-renewal of rhabdomyosarcoma
- Authors
- Pham, T.Q., Robinson, K., Xu, L., Pavlova, M.N., Skapek, S.X., Chen, E.Y.
- Source
- Full text @ Oncogene
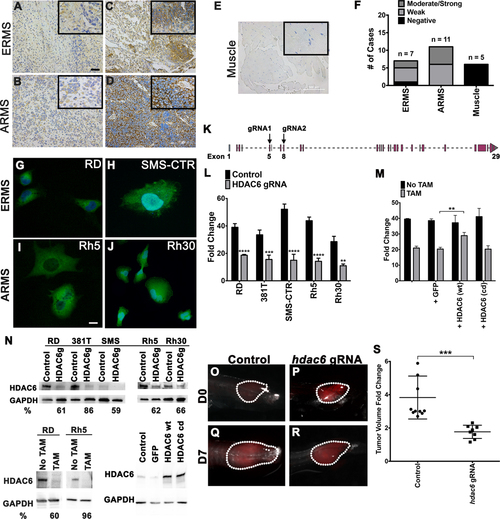
(A-E) Immunohistochemistry for HDAC6 in representative primary ERMS and ARMS tumors and skeletal muscle tissue. Weaker staining in (A-B) and stronger staining in (C-D). No staining in skeletal muscle (E). Scale bar = 100 μm. Inset (outlined by bold rectangle) shows a higher-magnification view. (F) Summary of IHC results in ERMS (n = 7), ARMS (n = 11) and skeletal muscle (n = 5) from human patients. (G-J) Immunofluorescense for HDAC6 in (G-H) ERMS cell lines (RD and SMS-CTR) and (I and J) ARMS cell lines (Rh5 and Rh30). (K) A schematic of hdac6 gRNA locations (exons 5 and 8) used for CRISPR-mediated gene targeting by lentivirus or tamoxifen-inducible system. (L) Summary of changes in cell growth by cell counts following transduction with lentivirus expressing Cas9 and double HDAC6 gRNAs for gene knockout (KO) in a panel of RMS cell lines. The results shown are as fold change in cell counts 5 days post-plating and represent the average of 3 replicates for each cell line from one of 3 independent experiments. (M) Overexpression of GFP as a control, Cas9-resistant wild-type (wt) HDAC6 and Cas9-resistant catalytically-dead (cd) HDAC6 in tamoxifen (TAM)-inducible Cas9/HDAC6 gRNA RD line to assess change in cell growth 6 days following TAM-induction. Results shown are the average of 4 replicates from one of 3 independent experiments. (N) Western blots against HDAC6 in ERMS cell lines (RD, 381T and SMS-CTR) and ARMS cell lines (Rh5 and Rh30) transduced with HDAC6 gRNAs and Cas9 6 days post-transduction (top panel); RD and Rh5 cells with TAM-inducible CRISPR-mediated targeted disruption of HDAC6 (bottom left panel) and in RD TAM-inducible Cas9/HDAC6 gRNA line overexpressing GFP, wt HDAC6 and cd HDAC6 (bottom right panel) 6 days post-TAM induction. HDAC6g = HDAC6 gRNA. GAPDH was used as a loading control. % depletion relative to the control following normalization to GAPDH as the loading control was quantified by Image J. (O-R) Representative zebrafish ERMS tumors expressing GFP scrambled gRNA control vector (O, Q) and Cas9/hdac6 gRNA (P, R) over 7 days of growth. (S) Summary of tumor growth. n = 10 for control tumors and n = 8 for double hdac6 gRNA-targeted ERMS tumors. Each error bar in graphs of L, M and S represents standard deviation. Two-tailed t-test; ** = p < 0.01; *** = p < 0.001; **** = p < 0.0001. |
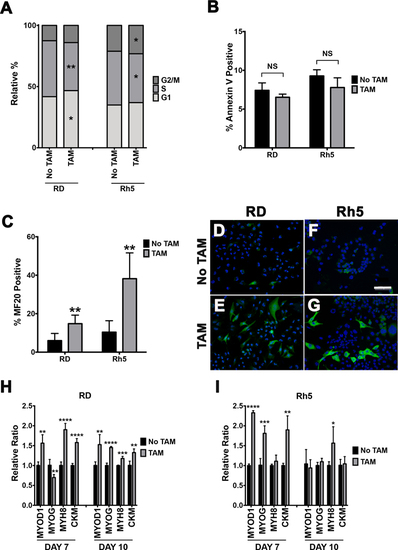
(A) EdU flow cytometry-based cell cycle analysis of tamoxifen-inducible Cas9-mediated HDAC6 targeted RD and Rh5 cells day 6 post-tamoxifen treatment. HDAC6g = HDAC6 gRNA. (B) Cell death analysis by Annexin V-based flow cytometry assay in the same RD and Rh5 cell lines 6 days post-tamoxifen treatment. Summary graphs in A-B are results from the average of 3 technical replicates from 1 representative experiment of 3 independent repeats. (C) Quantitation of immunofluorescence (IF) against MF20 in RD and Rh5 cells following 72 hours of serum starvation in 2% horse serum and 7 days post-tamoxifen-induced CRISPR/Cas9-mediated HDAC6 targeting. Average of 4 fields at 400X for each condition was shown. (D-G) Representative IF images in RD (D-E) and Rh5 (F-G) cells. Scale bar = 100 microns. (H-I) Quantitative RT-PCR assessing expression of myogenic genes 7 days and 10 days post tamoxifen-induced CRISPR-mediated HDAC6 gene disruption in RD and Rh5 cells. Results are the average of 4 replicates from one of three independent repeats. Two-tailed t-test was performed for data in A, B, C, H and I; * = p < 0.05; ** = p < 0.01; *** = p < 0.001; **** = p < 0.0001. |
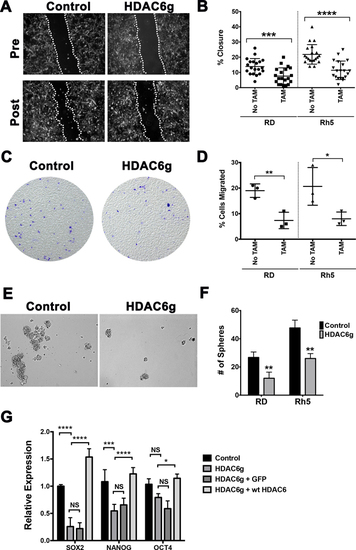
(A) Representative images from a wound healing scratch assay in RD cells with tamoxifen-induced CRISPR/Cas9 HDAC6 targeting. Post = 16 hours post-scratch. Dashed lines indicate migrating fronts. (B) Summary of scratch assays in RD and Rh5 with tamoxifen-inducible CRISPR/Cas9-mediated HDAC6 targeting in RD and Rh5. Each datapoint represents a distinct area of the gap. The results shown are from one representative experiment of at least 3 repeats. (C) Representative images from a transwell migration assay. Cells migrated to the bottom chamber were stained with crystal violet at 22 hours post-seeding in the top chamber. (D) Summary of transwell migration assays in RD and Rh5 with tamoxifen-inducible CRISPR HDAC6 targeting in RD and Rh5. Each data point represents a replicate well. Results shown are from one of 3 independent experiments. (E) Representative images from a sphere assay in RD cells. (F) Summary of sphere assays in RD and Rh5 cell lines 3 days post-plating. Shown are results of 4 replicates from one of 3 independent experiments. (G) RT-PCR analysis comparing expression levels of stem cell markers in RD sphere cells harboring no TAM control and TAM-induced HDAC6-targeting, TAM-induced HDAC6-targeting transduced with GFP expression construct and TAM-induced HDAC6-targeting transduced with Cas9-resistant wild-type HDAC6 expression construct harvested after 3 days of culturing in stem cell medium. Results were the average of 3 replicates from one of 3 independent experiments. Each error bar in B, D, F and G represents standard deviation. Two-tailed t-test in B, D and F; two-way ANOVA test in G; * = p <0.05; ** = p < 0.01; *** = p < 0.001; **** = p < 0.0001. |
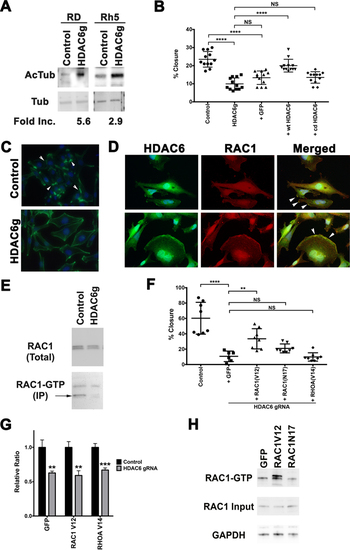
(A) Western blots against acetylated alpha-tubulin and alpha-tubulin in RD and Rh 5 cells with tamoxifen-induced CRISPR/Cas9-mediated targeted disruption of HDAC6 (day 6 post-tamoxifen). Fold increase in the levels of acetylated alpha-tubulin following normalization to the levels of alpha-tubulin was quantified using Image J. (B) Scratch assay assessing effects of adding back Cas9-resistant wild-type (wt) HDAC6 and catalytically-dead (cd) HDAC6 in RD cells with tamoxifen-induced HDAC6 targeting. Results at 16 hours post-scratch are shown from one representative experiment of at least 3 repeats. (C) Phalloidin staining in RD cells with no tamoxifen control and tamoxifen-induced HDAC6 CRISPR targeting following serum starvation and 15-minute EGF (50 ng/mL) treatment at day 6 post-tamoxifen treatment. Arrowheads point to representative areas of membrane ruffles and filopodia formation. Green = phalloidin, Blue = DAPI. (D) Double IF against HDAC6 (green) and RAC1 (red) in RD, showing HDAC6 and RAC1 expression in the regions of membrane ruffles (top panels) and folds (bottom panels), also highlighted by the arrowheads in merged panels. (E) RAC1 GTP pulldown assay in RD cells harboring no tamoxifen control and tamoxifen-induced HDAC6 CRISPR targeting. (F) Summary of scratch assays assessing the effects of lentiviral overexpression of GFP as a control, RAC1V12, RAC1N17 and RHOAV14 in the presence of tamoxifen-induced CRISPR-mediated targeted disruption of HDAC6 in RD cells at 16 hours post-scratch following 24 hours of serum starvation and 15 minutes of EGF (50 ng/mL) treatment. (G) Summary of cell growth change by cell counts over 6 days assessing the effects of overexpressing GFP as a control, RAC1V12 and RAC1N17 on cell growth of RD cells with tamoxifen-induced targeted disruption of HDAC6. Results were normalized to the no tamoxifen control for each comparison and represent the average of 4 replicates in one of 3 independent experiments. (H) RAC1-GTP pulldown assay in RD cells overexpressing GFP, RAC1V12 and RAC1N17 following 24 hours of serum starvation and 15 minutes of EGF (50 ng/mL) treatment. Each error bar in B, F and G represents standard deviation. Two-tailed t-test in B and G, one-way ANOVA test in F; NS = no significance, p < 0.05; ** = p < 0.01; *** = p < 0.001; **** = p < 0.0001. |
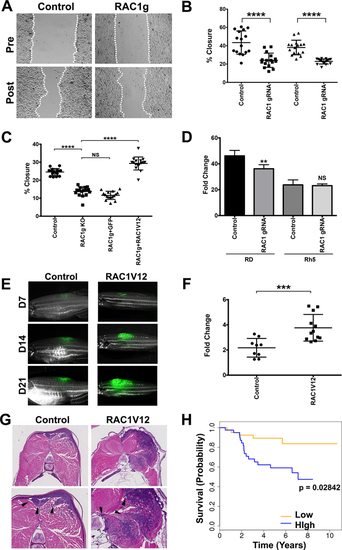
(A) Representative images of RD cells harboring safe-harbor control targeting and RAC1 gRNA targeting in a wound healing scratch assay. Dashed lines indicate migrating fronts. (B) Summary of scratch assays in RD and Rh5 cells with targeted disruption of RAC1. Each assay was analyzed at 16 hours post-scratch. The results from one of 3 independent replicate experiments are shown. (C) Summary of scratch assays in RD cells transduced with lentivirus expressing safe-habor control gRNA, RAC1 gRNA, RAC1 gRNA + GFP, RAC1 gRNA + RAC1V12 and analyzed at 16 hours post-scratch following plating at the same cell density at 80–90% confluence. (D) Summary of cell counts in RD and Rh5 cells at 7 days post-plating following lentiviral CRISPR/Cas9-mediated RAC1 gene disruption (starting cell density = 10,000). (E) Representative images of KRASG12D-induced zebrafish ERMS tumors co-expressing GFP and an empty vector (control) or mutant RAC1V12 at day 7, 14 and 21 post-transplantation. (F) Summary growth volume change for each fish over the first 7 days. n = 8 for control and n = 12 for human RAC1V12-expressing tumors. (G) Representative H&E images of control and RAC1V12 expressing zebrafish ERMS tumors. Lower panels show higher magnification with arrow heads indicating areas of skeletal muscle invasion by tumor cells. (H) Correlation of RAC1 expression levels with overall survival outcome in RMS patients (63 fusion-negative and 18 fusion-positive) by Kaplan-Meier analysis. Error bars in graphs of B, C, D and F represent standard deviation. Two-tailed t-test in B, D and F. One-way ANOVA with multiple comparisons in C; *** = p < 0.001; **** = p < 0.0001. |
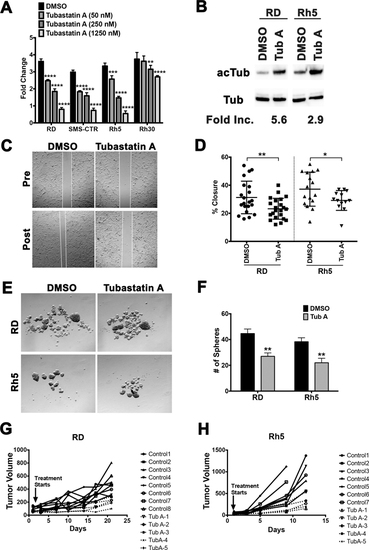
(A) Cell Titer Glo viability assays assessing the dose-dependent effect of tubastatin A on cell growth of RD and Rh5 cells over 5 days. Each dose was done in 4 replicate wells. Results from one representative experiment of at least 3 repeats are shown. (B) Western blots with antibodies against acetylated alpha-tubulin (acTub) and alpha-tubulin (Tub) in RD and Rh5 cells treated with DMSO (vehicle control) or tubastatin A (200 nM) at 24 hours. Fold increase in the levels of acetylated alpha-tubulin following normalization to the levels of alpha-tubulin was quantified using Image J. (C) Representative images from a scratch assay in RD cells following treatment with DMSO (vehicle) or tubastatin A (200 nM). (D) Summary of scratch assay analysis in RD and Rh5 cells treated with DMSO or tubastatin A (16 hours post-scratch). Results shown are from one representative experiment of 3 repeats. (E) Representative images of sphere assays in RD and Rh5 cells treated with DMSO or tubastatin A (200 nM) for 3 days. (F) Summary of sphere assay analysis in RD and Rh5 cells from one representative experiment of 3 repeats. (G-H) RMS xenografts were established using the RD cell line (G) and Rh5 cell line (H) and treated with tubastatin A (10 mg per kg per mouse, intraperitoneal injections every 3 days for up to 21 days). Treatment for Rh5 xenografts ended early due to many control tumors reaching tumor end point (750 mm3) per approved animal protocol. Tumor volume change over the treatment period is shown for each tumor-bearing mouse. Each data point represents a mouse. Each error bar in the graphs of A, D and F represents standard deviation. Two-tailed Student’s t-test; * = p < 0.05; ** = p < 0.01; *** = p < 0.001; **** = p < 0.0001. |