
|
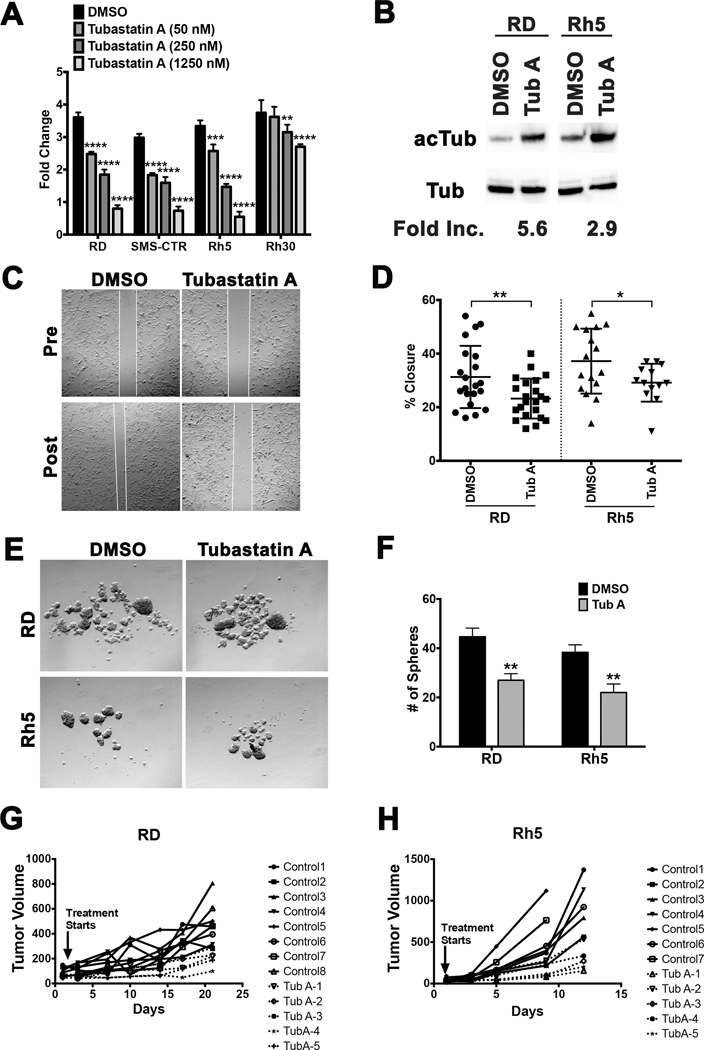
Figure 6. (A) Cell Titer Glo viability assays assessing the dose-dependent effect of tubastatin A on cell growth of RD and Rh5 cells over 5 days. Each dose was done in 4 replicate wells. Results from one representative experiment of at least 3 repeats are shown. (B) Western blots with antibodies against acetylated alpha-tubulin (acTub) and alpha-tubulin (Tub) in RD and Rh5 cells treated with DMSO (vehicle control) or tubastatin A (200 nM) at 24 hours. Fold increase in the levels of acetylated alpha-tubulin following normalization to the levels of alpha-tubulin was quantified using Image J. (C) Representative images from a scratch assay in RD cells following treatment with DMSO (vehicle) or tubastatin A (200 nM). (D) Summary of scratch assay analysis in RD and Rh5 cells treated with DMSO or tubastatin A (16 hours post-scratch). Results shown are from one representative experiment of 3 repeats. (E) Representative images of sphere assays in RD and Rh5 cells treated with DMSO or tubastatin A (200 nM) for 3 days. (F) Summary of sphere assay analysis in RD and Rh5 cells from one representative experiment of 3 repeats. (G-H) RMS xenografts were established using the RD cell line (G) and Rh5 cell line (H) and treated with tubastatin A (10 mg per kg per mouse, intraperitoneal injections every 3 days for up to 21 days). Treatment for Rh5 xenografts ended early due to many control tumors reaching tumor end point (750 mm3) per approved animal protocol. Tumor volume change over the treatment period is shown for each tumor-bearing mouse. Each data point represents a mouse. Each error bar in the graphs of A, D and F represents standard deviation. Two-tailed Student’s t-test; * = p < 0.05; ** = p < 0.01; *** = p < 0.001; **** = p < 0.0001.