
|
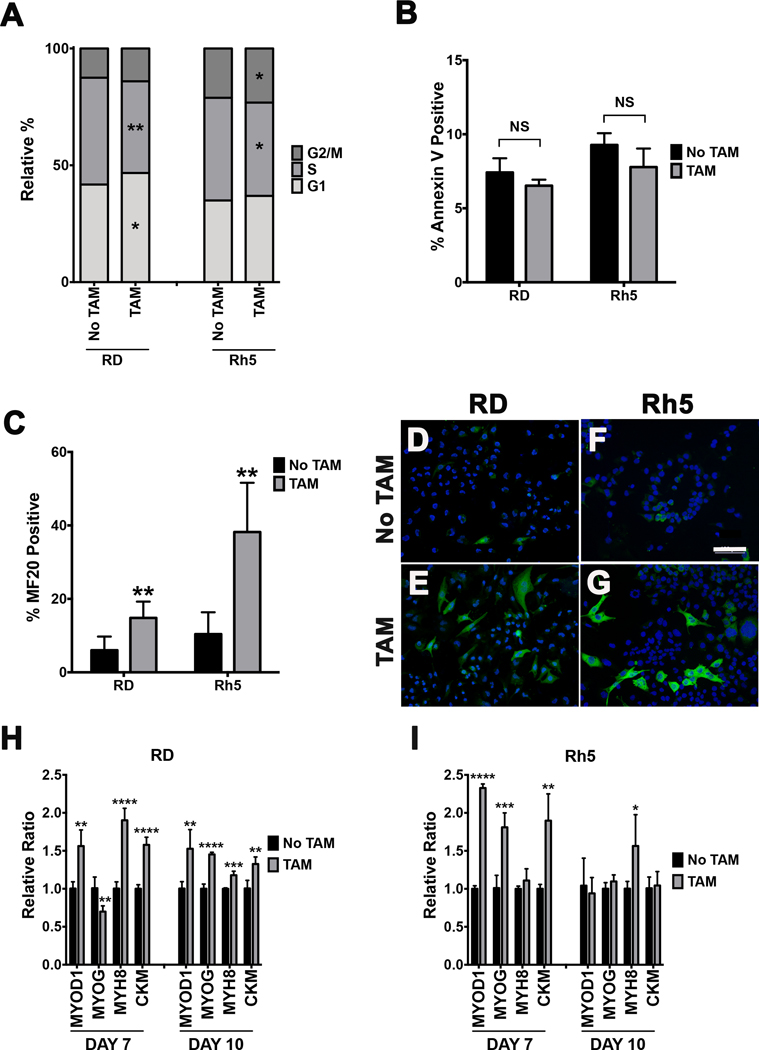
Figure 2. (A) EdU flow cytometry-based cell cycle analysis of tamoxifen-inducible Cas9-mediated HDAC6 targeted RD and Rh5 cells day 6 post-tamoxifen treatment. HDAC6g = HDAC6 gRNA. (B) Cell death analysis by Annexin V-based flow cytometry assay in the same RD and Rh5 cell lines 6 days post-tamoxifen treatment. Summary graphs in A-B are results from the average of 3 technical replicates from 1 representative experiment of 3 independent repeats. (C) Quantitation of immunofluorescence (IF) against MF20 in RD and Rh5 cells following 72 hours of serum starvation in 2% horse serum and 7 days post-tamoxifen-induced CRISPR/Cas9-mediated HDAC6 targeting. Average of 4 fields at 400X for each condition was shown. (D-G) Representative IF images in RD (D-E) and Rh5 (F-G) cells. Scale bar = 100 microns. (H-I) Quantitative RT-PCR assessing expression of myogenic genes 7 days and 10 days post tamoxifen-induced CRISPR-mediated HDAC6 gene disruption in RD and Rh5 cells. Results are the average of 4 replicates from one of three independent repeats. Two-tailed t-test was performed for data in A, B, C, H and I; * = p < 0.05; ** = p < 0.01; *** = p < 0.001; **** = p < 0.0001.