
Figure 5.
- ID
- ZDB-FIG-210518-68
- Publication
- Pham et al., 2020 - HDAC6 promotes growth, migration/invasion, and self-renewal of rhabdomyosarcoma
- Other Figures
- All Figure Page
- Back to All Figure Page
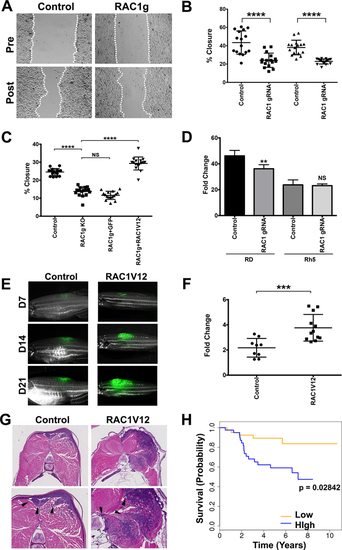
(A) Representative images of RD cells harboring safe-harbor control targeting and RAC1 gRNA targeting in a wound healing scratch assay. Dashed lines indicate migrating fronts. (B) Summary of scratch assays in RD and Rh5 cells with targeted disruption of RAC1. Each assay was analyzed at 16 hours post-scratch. The results from one of 3 independent replicate experiments are shown. (C) Summary of scratch assays in RD cells transduced with lentivirus expressing safe-habor control gRNA, RAC1 gRNA, RAC1 gRNA + GFP, RAC1 gRNA + RAC1V12 and analyzed at 16 hours post-scratch following plating at the same cell density at 80–90% confluence. (D) Summary of cell counts in RD and Rh5 cells at 7 days post-plating following lentiviral CRISPR/Cas9-mediated RAC1 gene disruption (starting cell density = 10,000). (E) Representative images of KRASG12D-induced zebrafish ERMS tumors co-expressing GFP and an empty vector (control) or mutant RAC1V12 at day 7, 14 and 21 post-transplantation. (F) Summary growth volume change for each fish over the first 7 days. n = 8 for control and n = 12 for human RAC1V12-expressing tumors. (G) Representative H&E images of control and RAC1V12 expressing zebrafish ERMS tumors. Lower panels show higher magnification with arrow heads indicating areas of skeletal muscle invasion by tumor cells. (H) Correlation of RAC1 expression levels with overall survival outcome in RMS patients (63 fusion-negative and 18 fusion-positive) by Kaplan-Meier analysis. Error bars in graphs of B, C, D and F represent standard deviation. Two-tailed t-test in B, D and F. One-way ANOVA with multiple comparisons in C; *** = p < 0.001; **** = p < 0.0001. |