
Figure 1.
- ID
- ZDB-FIG-210518-64
- Publication
- Pham et al., 2020 - HDAC6 promotes growth, migration/invasion, and self-renewal of rhabdomyosarcoma
- Other Figures
- All Figure Page
- Back to All Figure Page
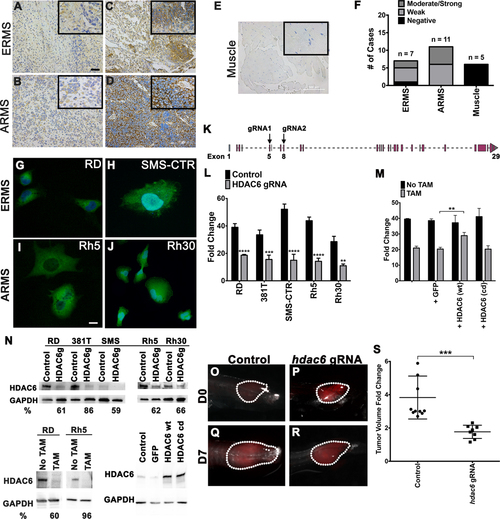
(A-E) Immunohistochemistry for HDAC6 in representative primary ERMS and ARMS tumors and skeletal muscle tissue. Weaker staining in (A-B) and stronger staining in (C-D). No staining in skeletal muscle (E). Scale bar = 100 μm. Inset (outlined by bold rectangle) shows a higher-magnification view. (F) Summary of IHC results in ERMS (n = 7), ARMS (n = 11) and skeletal muscle (n = 5) from human patients. (G-J) Immunofluorescense for HDAC6 in (G-H) ERMS cell lines (RD and SMS-CTR) and (I and J) ARMS cell lines (Rh5 and Rh30). (K) A schematic of hdac6 gRNA locations (exons 5 and 8) used for CRISPR-mediated gene targeting by lentivirus or tamoxifen-inducible system. (L) Summary of changes in cell growth by cell counts following transduction with lentivirus expressing Cas9 and double HDAC6 gRNAs for gene knockout (KO) in a panel of RMS cell lines. The results shown are as fold change in cell counts 5 days post-plating and represent the average of 3 replicates for each cell line from one of 3 independent experiments. (M) Overexpression of GFP as a control, Cas9-resistant wild-type (wt) HDAC6 and Cas9-resistant catalytically-dead (cd) HDAC6 in tamoxifen (TAM)-inducible Cas9/HDAC6 gRNA RD line to assess change in cell growth 6 days following TAM-induction. Results shown are the average of 4 replicates from one of 3 independent experiments. (N) Western blots against HDAC6 in ERMS cell lines (RD, 381T and SMS-CTR) and ARMS cell lines (Rh5 and Rh30) transduced with HDAC6 gRNAs and Cas9 6 days post-transduction (top panel); RD and Rh5 cells with TAM-inducible CRISPR-mediated targeted disruption of HDAC6 (bottom left panel) and in RD TAM-inducible Cas9/HDAC6 gRNA line overexpressing GFP, wt HDAC6 and cd HDAC6 (bottom right panel) 6 days post-TAM induction. HDAC6g = HDAC6 gRNA. GAPDH was used as a loading control. % depletion relative to the control following normalization to GAPDH as the loading control was quantified by Image J. (O-R) Representative zebrafish ERMS tumors expressing GFP scrambled gRNA control vector (O, Q) and Cas9/hdac6 gRNA (P, R) over 7 days of growth. (S) Summary of tumor growth. n = 10 for control tumors and n = 8 for double hdac6 gRNA-targeted ERMS tumors. Each error bar in graphs of L, M and S represents standard deviation. Two-tailed t-test; ** = p < 0.01; *** = p < 0.001; **** = p < 0.0001. |