|
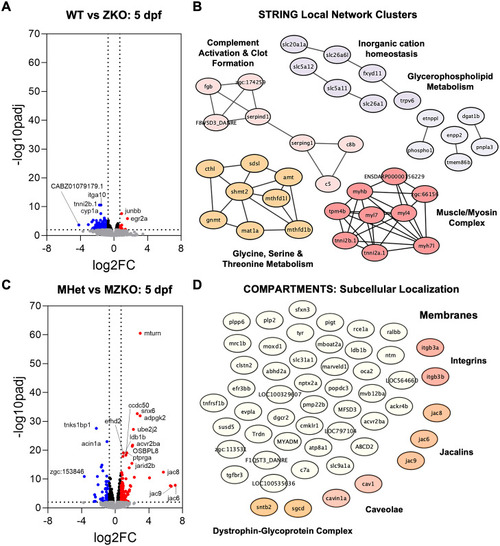
Differential gene expression analysis at 5 dpf. A: Volcano plot showing 203 downregulated DEGs and 17 upregulated DEGs in ZKOs compared to their WT siblings. B: STRING local networks analysis of downregulated DEGs showing networks of interacting proteins involved in complement activation and clot formation, inorganic cation homeostasis, glycerophospholipid metabolism, amino acid metabolism (glycine, serine, threonine), and muscle function within the myosin II complex. C: Volcano plot showing 84 downregulated DEGs and 159 upregulated DEGs in MZKOs compared to their MHet siblings. D: Subcellular localization analysis of the downregulated DEGs in C through COMPARTMENTS showing an enrichment in genes that encode proteins that are present in the membrane.
|