FIGURE SUMMARY
Title

The transcription factors Tfeb and Tfe3 are required for survival and embryonic development of pancreas and liver in zebrafish

Authors
Rissone, A., La Spina, M., Bresciani, E., Syed, Z.A., Combs, C.A., Kirby, M., Elkahloun, A., Chen, V., Sood, R., Burgess, S.M., Puertollano, R.
Source
Full text @ PLoS Genet.

Generation of zebrafish tfeb, tfe3a and tfe3b triple knockout mutants.

(A) Genomic coding structure of the zebrafish tfeb, tfe3a and tfe3b genes and schematic illustration of the major structural domains of their different forms. The coding exons targeted in genome-editing using CRISPR/Cas9 have been marked with asterisks, alternative first coding exons are highlighted in orange. Exons/introns are not drawn to the scale. RAG-BD, RAG binding domain; TA, transactivation domain; S, 14-3-3 binding motif; bHLH, beta Helix-Loop-Helix; LZ, leucine zipper domain. (B) Real-time qPCR analysis showing reduction of tfeb, tfe3a and tfe3b expression in 2 dpf TKO embryos. The data represent means ± SEM, n = 3 independent experiments. Statistical significance was determined by using two-way ANOVA with Sidak’s multiple comparisons. n.s., not significant, **** < 0.0001. (C) Representative pictures of a 4-months-old TKO fish (top) and its sibling fish (bottom) in a DC-96 genotyping tank. (D) Comparison of H&E-stained longitudinal sections of WT and TKO 4-months-old fish embedded in paraffin. (Top) Representative pictures of the ovary of TKO small adult female fish showing the lack of mature oocytes in the TKO ovaries. Different stages of primary oocytes (S2, S3, S4, S6 and S7) are indicated. S2, S3 represent the previtellogenic stages; S6 and S7 are the last stages of oocytes maturation. (Bottom) Representative pictures of testis of 4-months-old control and TKO small adult male fish. Scale bars, 250 μm. (E) Comparison of body length (left) and body size (right) between 12-months-old WT and TKO male and female fish. The data represent means ± SEM. Statistical significance was determined by Welch’s two-tailed t-test. * < 0.05, ** < 0.01, *** < 0.001 and **** < 0.0001. (F) Representative pictures of 12-months-old WT and TKO fish used for the quantification in (E). (G) Comparison of body length and size among different males (top panels) and female (bottom panels) adult fish. WT used are 18- and 20-months-old, TKO and their siblings are 24-months-old. The data represent means ± SEM. Statistical significance was calculated using ordinary one-way ANOVA with Tukey’s multiple comparison test, with a single pooled variance. * < 0.05, ** < 0.01, *** < 0.001 and **** < 0.0001. (H) Kaplan-Meier curves showing the percentage of survival (y axis) of WT and TKO embryos (TKOa and TKOb) through time (x axis) while growing into the aquatic system from 6 dpf (time point 0). Numbers in parenthesis indicate the number of embryos used. (Log-rank (Mantel-Cox) test: **** < 0.0001). (I) Representative Kaplan-Meier curves showing the percentage of survival (y axis) of the embryos from two different crosses through time (x axis). Numbers in parenthesis indicate the number of embryos used. (Log-rank (Mantel-Cox) test: **** < 0.0001).

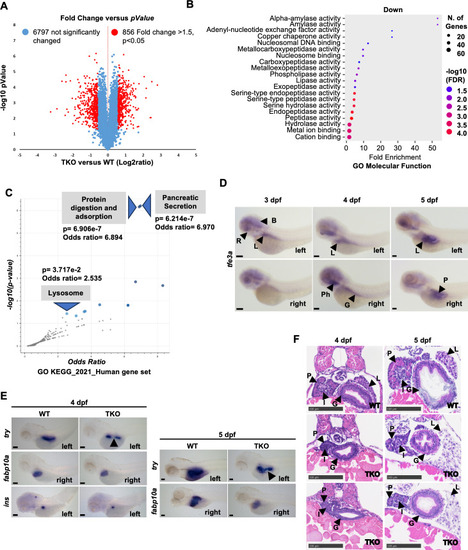
Proteomic and phenotypical analysis of 5 dpf WT and TKO embryos.

(A) Volcano plot showing the fold change of 7652 protein abundance between TKO zebrafish group and WT group (n = 3). The x-axis represents the log2 of fold changes, and the y-axis represents the statistically significant p-value (-log10 of p-value, n = 3). Blue dots represent 6797 proteins fold change <1.5, red dots are 856 differentially expressed proteins with a fold change >1.5, p < 0.05. (B) ShinyGO Molecular Function term enrichment of the proteins significantly downregulated in TKO mutants compared to WT siblings. FDR, false discovery rate. (C) Volcano plot of terms from the KEGG_2021_Human gene set using Enrichr. Each point represents a single term, plotted by the corresponding odds ratio (x-position) and -log10(p-value) (y-position). Blue points represent significant terms (p-value < 0.05); smaller gray points represent non-significant terms. (D) WISH analysis with an antisense probe against tfe3a transcripts during WT embryo development. Top and bottom panels show left and right sides of the embryos, respectively. Anterior to the left. B, brain; G, gut; L, liver; P, pancreas; Ph, pharynx; R, retina. Scale bars, 100 μm. (E) WISH analysis with an antisense probe for pancreatic (try and ins) and hepatic (fabp10a) markers in WT and TKO at 4 and 5 dpf. Arrowheads point to strong reduction of try signal in TKO embryos. Lateral positions, anterior to the left. Scale bars, 100 μm. (F) H&E staining of 5 μm transversal sections showing the gastro-intestinal organs in the trunk of paraffin embedded 4 and 5 dpf WT and TKO embryos. G, gut; I, islet; L, liver; P, exocrine pancreas. Scale bars, 100 μm.

Pancreatic defects observed in TKO embryos and adult fish.

(A) Representative max-projections (green) and Imaris 3D reconstructions (yellow) of confocal Z-stacks of 2CLIP WT and TKO embryos at 6 dpf showing the different classes of phenotypes of the mutant embryos. Dorsal views, anterior to the left. Scale bars, 30 μm. (B) Quantification of the % of pancreas phenotypes observed in WT and TKO embryo populations during development from 4 to 6 dpf. (C) Representative EM pictures comparing acinar cells in WT and TKO 5 dpf embryos. White arrows: zymogen granules in autolysomes. Scale bars, 2 μm. Inset scale bars: 0.8 μm. (D-E) Quantification of zymogen granules size (D) and quality (E) in WT and TKO embryos at 5 dpf. The data represent means ± SEM. Statistical significance was determined by unpaired two-tailed t-test. **** < 0.0001. (F) H&E histological analysis of 4 months old WT and TKO adult fish showing mild signs of pancreatic inflammation (edema, eosin-neg zymogen granules). Insets are showing the edema and the lack of eosin positivity in the TKO mutant pancreas more in detail. Scale bars, 50 μm. (G) Representative EM images of pancreatic tissues from adult WT and TKO fish. Scale bars: 800 and 400 nm. Black arrows mark dilated endoplasmic reticulum and nuclear envelop; red arrowheads label ruptures in the zymogen granule membrane. AL, autolysosome; m, mitochondria; N, nucleus; ZG, zymogen granule; ZG*, abnormal granules.

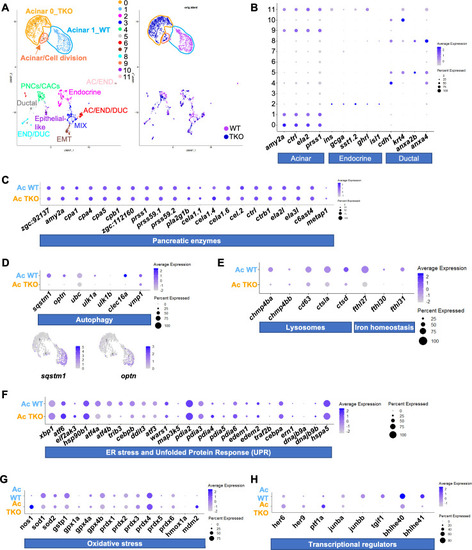
Single cell RNA-sequencing of 4 dpf WT and TKO GFP

+cells.(A) (Left) UMAP showing clustering of merged WT and TKO GFP+ datasets. Each cluster identity has been annotated in the plot. Acinar cell clusters have been highlighted. (Right) UMAP displaying the projection of the two genotypes (WT and TKO) merged for the analysis. (B) Dot plots showing the expression of acinar, endocrine and ductal gene markers in merged WT and TKO datasets as shown in (A). (C) Dot plot showing the expression of the pancreatic proteins found downregulated in the proteomic analysis of 5 dpf WT and TKO embryos. (D) (Top) Dot plot showing expression of genes involved in autophagy in TKO and WT acinar cell (Ac) clusters. (Bottom) feature plots depicting the expression level of specific autophagic markers in acinar cell clusters as shown in (A) (purple is high, gray is low). (E-G) Dot plot showing expression in TKO and WT acinar cell (Ac) clusters of genes involved in different cellular processes: lysosomes and iron homeostasis (E), ER stress and UPR (F) and oxidative stress (G). (H) Dot plot showing examples of genes differentially expressed in TKO and WT acinar cells at 4 dpf. In each dot plot, the size of the dots encodes the percentage of cells within a class, the color indicates the average level of expression (purple is high, grey is low). Graphics in S4A Fig were created with BioRender.com.

Liver and gut defects observed in TKO embryos.

(A) (Left) Representative max-projection of confocal Z-stacks of a FUCCI TKO embryo at 5 dpf. The dashed yellow and white lines highlight the left lobe liver and the gut, respectively. Lateral views, anterior to the left and dorsal to the bottom. Scale bar, 20 μm. (Right) Pictures of the same single plane over time from each confocal Z-stack. For clarity, only the gut region is highlighted with a white long-dashed dot line. Arrowheads point at the same cerulean+ cells over time. Numbers indicate the time of each frame; each hour the timer is restarting from zero. (B) Quantification of the number of G0/G1 nuclei per volume (39µm3) in the left lobe of the liver of WT and TKO at 6.5 dpf. (C) Representative EM pictures showing subcellular organization of hepatocytes in 5 dpf WT and TKO embryos. Different grades of severity have been observed in TKO hepatocytes. Dashed black rectangles highlight the insets. m, mitochondria, L, lipid droplets, g, glycogen lacunae, yellow asterisks mark the peroxisomes. Blue arrows point to mitochondria showing signs of distress (intracristal swelling and blistering of the external membrane). Specific scale bars are indicated for each picture. (D-E) Quantitative analysis of glycogen content in WT and TKO at different stages. (D) Analysis performed using ImageJ (Fiji) on EM images at the same magnification from WT and TKO at 5dpf. (E) Glucose content (μmol/grams of embryonic tissue) quantification after amyloglucosidase digestion in WT and TKO embryos at 4 and 5 dpf. (F) Representative EM pictures comparing gut epithelial cells in WT and TKO 5 dpf embryos. Scale bars, 4 μm (top) and 1 μm (bottom). N, nucleus, MV, microvilli. (G) Quantification of the microvilli density (# of microvilli/µm) in 5 dpf WT and TKO gut epithelial cells. The data represent means ± SEM. Statistical significance was determined by unpaired two-tailed t-tests. * < 0.05, *** < 0.001 and **** < 0.0001.

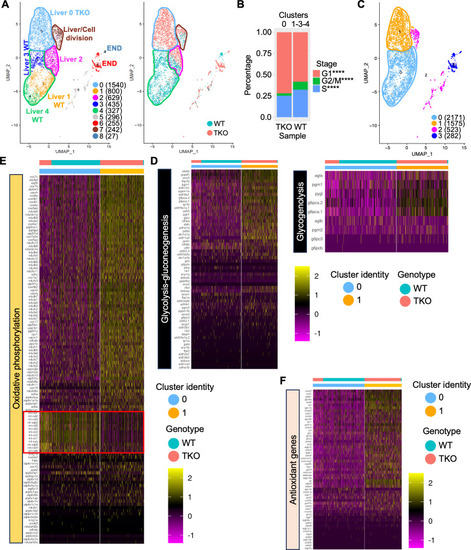
Single cell RNA-sequencing of 4 dpf WT and TKO dsRED

+cells.(A) (Left) UMAP showing the clustering of merged WT and TKO dsRED+ cells. Liver and endocrine pancreatic cell cluster identity has been annotated in the plot. The total number of cells in each cluster in shown in parenthesis. (Right) UMAP displaying the projection of the two genotypes (WT and TKO) merged for the analysis. Major liver clusters have been highlighted. (B) Analysis of the cell cycle using Seurat CellCycleScoring function in WT and TKO hepatic cells. Statistical significance was determined using Fisher’s exact test. **** < 0.0001. (C-F) Heat maps showing expression of metabolic genes involved in glycolysis/gluconeogenesis and glycogenolysis (D), oxidative phosphorylation (E), and antioxidant genes (F) at single-cell level in WT and TKO liver cell clusters highlighted in the specific UMAP (C). Numbers in parenthesis indicate the total number of cells for each cluster.

TKO embryos show higher sensitivity to different kinds of cellular stress.

(A-D) Kaplan-Meier curves comparing the survival rates of WT and TKO embryos at increasing doses of NaAsO2 (untreated (A), 1mM (B), 1.5 mM (C), 2 mM (D)). At each dosage, WT embryos were used as controls. The number of embryos per group is indicated in parenthesis. (E-I) Kaplan-Meier curves showing the survival rates of WT and TKO embryos following continuous exposure to heat shock treatments until 3 dpf. The red dashed lines highlight the beginning of each heat-shock (HS) treatment. Untreated embryos (E) were used as a control for the quality of the batch of embryos used for the treatments. In each treatment, WT embryos were used as internal controls. The number in parenthesis indicate the embryos used in each treatment. Logrank tests: **** < 0.0001. Data show one representative experiment out of three independently performed.

ZFIN is incorporating published figure images and captions as part of an ongoing project. Figures from some publications have not yet been curated, or are not available for display because of copyright restrictions.

Acknowledgments
This image is the copyrighted work of the attributed author or publisher, and ZFIN has permission only to display this image to its users. Additional permissions should be obtained from the applicable author or publisher of the image. Full text @ PLoS Genet.