IMAGE

Fig 7

ID
ZDB-IMAGE-250705-16
Source
Figures for Rissone et al., 2025
Image
Figure Caption

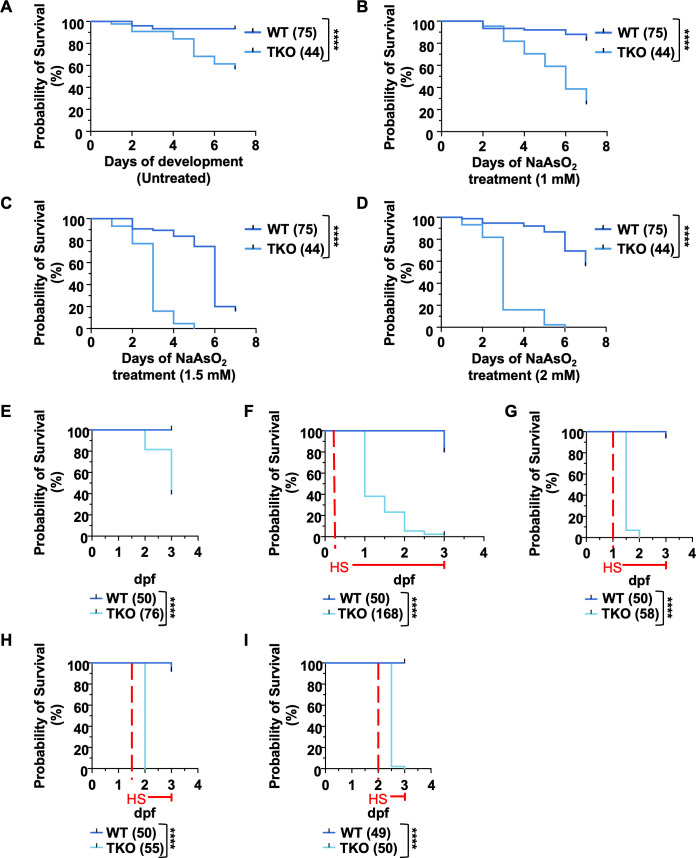
Fig 7 TKO embryos show higher sensitivity to different kinds of cellular stress.

(A-D) Kaplan-Meier curves comparing the survival rates of WT and TKO embryos at increasing doses of NaAsO2 (untreated (A), 1mM (B), 1.5 mM (C), 2 mM (D)). At each dosage, WT embryos were used as controls. The number of embryos per group is indicated in parenthesis. (E-I) Kaplan-Meier curves showing the survival rates of WT and TKO embryos following continuous exposure to heat shock treatments until 3 dpf. The red dashed lines highlight the beginning of each heat-shock (HS) treatment. Untreated embryos (E) were used as a control for the quality of the batch of embryos used for the treatments. In each treatment, WT embryos were used as internal controls. The number in parenthesis indicate the embryos used in each treatment. Logrank tests: **** < 0.0001. Data show one representative experiment out of three independently performed.

Figure Data
Acknowledgments
This image is the copyrighted work of the attributed author or publisher, and ZFIN has permission only to display this image to its users. Additional permissions should be obtained from the applicable author or publisher of the image. Full text @ PLoS Genet.