IMAGE

Fig 2

ID
ZDB-IMAGE-250705-11
Genes
Source
Figures for Rissone et al., 2025
Image
Figure Caption

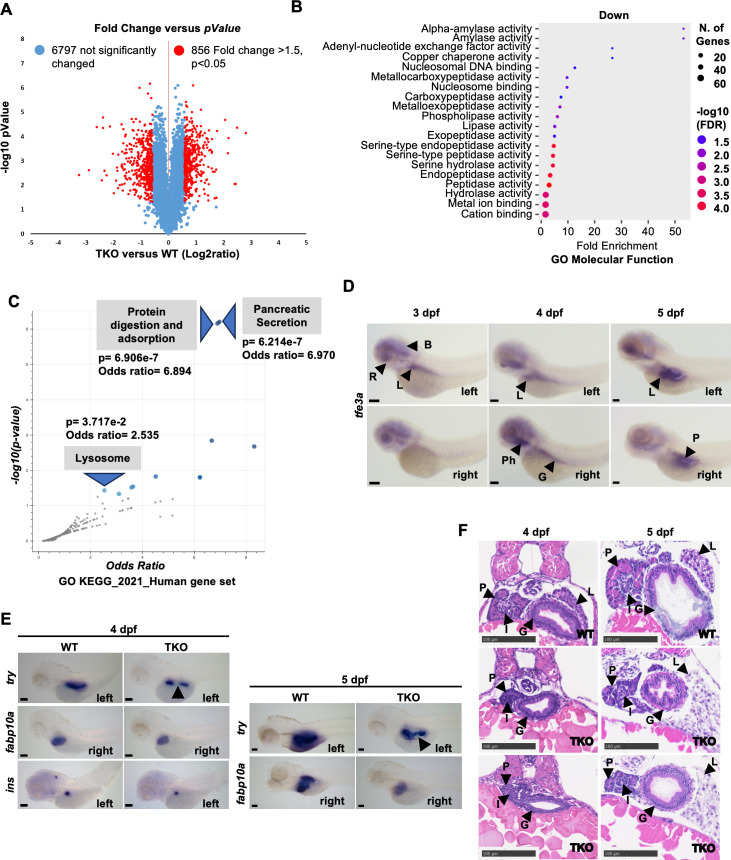
Fig 2 Proteomic and phenotypical analysis of 5 dpf WT and TKO embryos.

(A) Volcano plot showing the fold change of 7652 protein abundance between TKO zebrafish group and WT group (n = 3). The x-axis represents the log2 of fold changes, and the y-axis represents the statistically significant p-value (-log10 of p-value, n = 3). Blue dots represent 6797 proteins fold change <1.5, red dots are 856 differentially expressed proteins with a fold change >1.5, p < 0.05. (B) ShinyGO Molecular Function term enrichment of the proteins significantly downregulated in TKO mutants compared to WT siblings. FDR, false discovery rate. (C) Volcano plot of terms from the KEGG_2021_Human gene set using Enrichr. Each point represents a single term, plotted by the corresponding odds ratio (x-position) and -log10(p-value) (y-position). Blue points represent significant terms (p-value < 0.05); smaller gray points represent non-significant terms. (D) WISH analysis with an antisense probe against tfe3a transcripts during WT embryo development. Top and bottom panels show left and right sides of the embryos, respectively. Anterior to the left. B, brain; G, gut; L, liver; P, pancreas; Ph, pharynx; R, retina. Scale bars, 100 μm. (E) WISH analysis with an antisense probe for pancreatic (try and ins) and hepatic (fabp10a) markers in WT and TKO at 4 and 5 dpf. Arrowheads point to strong reduction of try signal in TKO embryos. Lateral positions, anterior to the left. Scale bars, 100 μm. (F) H&E staining of 5 μm transversal sections showing the gastro-intestinal organs in the trunk of paraffin embedded 4 and 5 dpf WT and TKO embryos. G, gut; I, islet; L, liver; P, exocrine pancreas. Scale bars, 100 μm.

Figure Data
Acknowledgments
This image is the copyrighted work of the attributed author or publisher, and ZFIN has permission only to display this image to its users. Additional permissions should be obtained from the applicable author or publisher of the image. Full text @ PLoS Genet.