
- Title
-
Highly quantitative measurement of differential protein-genome binding with PerCell chromatin sequencing
- Authors
- Tallan, A., Kucinski, J., Sunkel, B., Taslim, C., LaHaye, S., Liu, Q., Qi, J., Wang, M., Kendall, G.C., Stanton, B.Z.
- Source
- Full text @ Cell Rep Methods
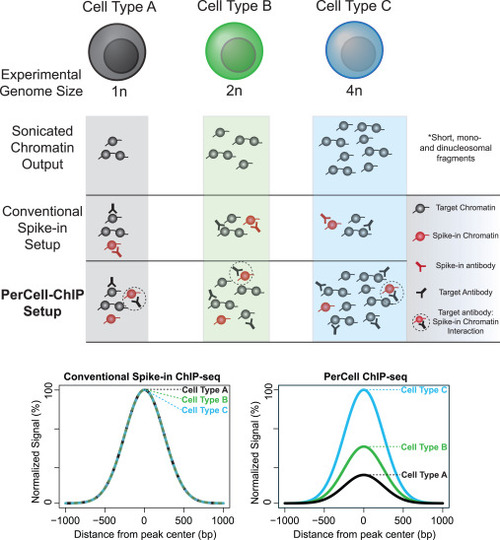
Rationale for PerCell-normalized semi-automated ChIP-seq analysis Shown are conceptual representations and comparisons of ChIP results after analyzing cells of varying ploidy (1n, 2n, and 4n) via conventional spike-in or PerCell normalization. The PerCell methodology specifically enables the detection of changes in relative signal across cellular backgrounds with different chromatin content and the use of a single antibody. |
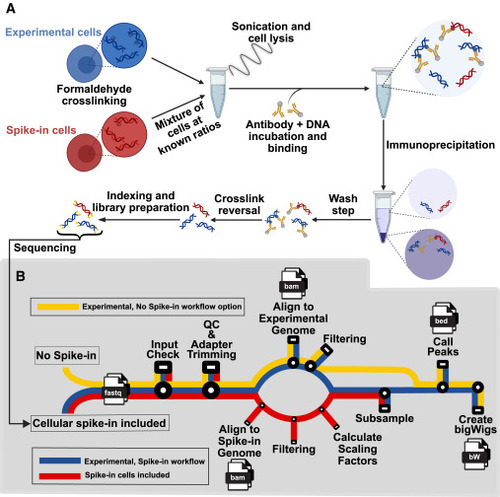
PerCell workflow (A) Workflow summary for the PerCell spike-in ChIP-seq wet lab procedure. Experimental cells (blue) and spike-in cells (red) of orthogonal species are separately crosslinked with chromatin-associated proteins via formaldehyde fixation before being mixed at known ratios that remain consistent for each sample. Experimental and spike-in cells proceed together throughout the remainder of the protocol. Cells are sonicated to solubilize DNA fragments of appropriate length, incubated with an antibody targeting a protein of interest, immunoprecipitated, and washed. Crosslinking is reversed to yield chromatin enriched for sequences interacting with the protein of interest, and the DNA is prepared for sequencing with identifying indexing as necessary and finally sequenced. (B) Subway map for the semi-automated PerCell normalization analysis pipeline with cellular spike-in (red), experimental chromatin (blue), or the workflow with no spike-in option (yellow). With a streamlined user interface, our pipeline will automate the central processes for cellular spike-in chromatin normalization per cell, including downsampling for peak calling and generation of bigWig files. In our updated semi-automated pipeline, we include the option to either include or not include spike-in, which creates versatility and applicability for an increased range of researchers and projects. |
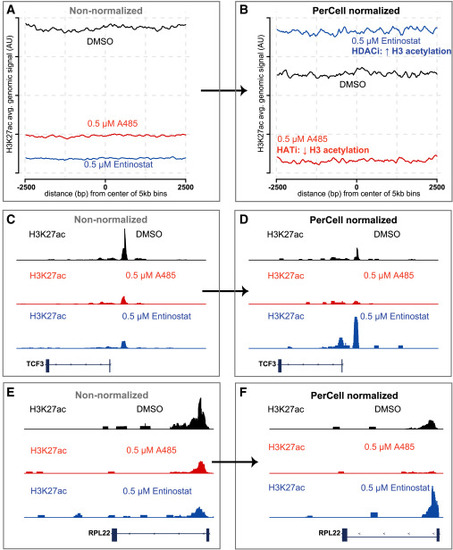
Data from human cancer cells (rhabdomyosarcoma Rh4 with C2C12 mouse myoblast cellular spike-in) with anti-H3K27ac PerCell ChIP-seq after DMSO, 0.5 μM A485, or 0.5 μM entinostat treatment (A and B) Non-normalized (A) and PerCell-normalized (B) H3K27ac ChIP-seq signal from Rh4 cells treated with DMSO, 0.5 μM A485 (a histone acetyltransferase inhibitor), or 0.5 μM entinostat (a histone deacetylase inhibitor). Average signal is shown in arbitrary units (a.u.) across the entire genome, divided into 5-kb bins. (C–F) Non-normalized (C and E) and PerCell-normalized (D and F) signal of the same samples at representative loci decorated with histone H3 acetylation, including TCF3 (C and D) and RPL22 (E and F), respectively. |
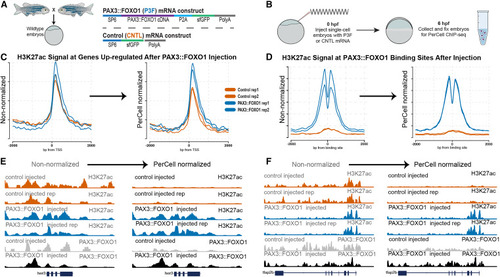
Zebrafish injected with control vs. PAX3::FOXO1 (P3F) mRNA in anti-H3K27ac and anti-FOXO1 (P3F) PerCell ChIP-seq experiments (A and B) Experimental design workflow, including PAX3::FOXO1 (P3F) and control mRNA constructs (A) and our zebrafish embryo injection strategy (B). (C and D) Profile plots of non-normalized (left) versus normalized (right) data for control and P3F construct injection at upregulated genes (C) or known P3F genomic binding sites (D). (E and F) Genome browser views at the her3 (E) and the tfap2b gene loci (F), where P3F expression in zebrafish embryos increases adjacent histone H3K27ac levels, which can be quantified with PerCell ChIP-seq. In each case, the magnitude of P3F binding is also measured with our PerCell workflow. |
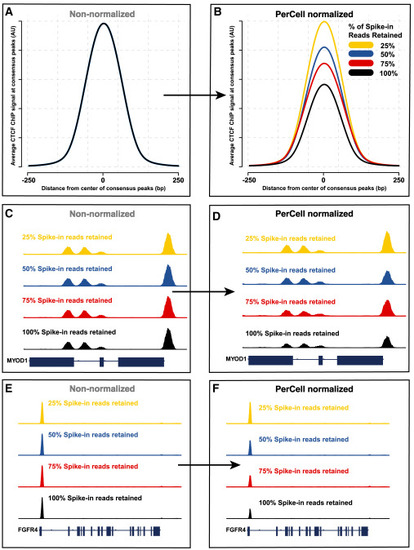
Quantitative PerCell differences in relative genome sizes (A and B) Non-normalized (A) and PerCell-normalized (B) CTCF ChIP signal in Rh4 human rhabdomyosarcoma cancer cells with varying percentages of cellular spike-in reads removed (resulting in 25%, 50%, 75%, or 100% of reads being retained) before application of the PerCell pipeline. Signal is shown ±250 bp of consensus CTCF called peaks. (C–F) Non-normalized (C and E) and PerCell-normalized (D and F) signal at the MYOD1 (C and D) or FGFR4 (E and F) locus. |