
|
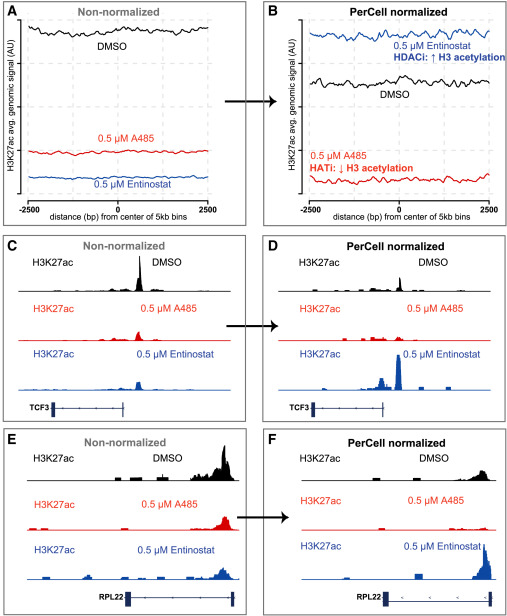
Fig. 3 Data from human cancer cells (rhabdomyosarcoma Rh4 with C2C12 mouse myoblast cellular spike-in) with anti-H3K27ac PerCell ChIP-seq after DMSO, 0.5 μM A485, or 0.5 μM entinostat treatment (A and B) Non-normalized (A) and PerCell-normalized (B) H3K27ac ChIP-seq signal from Rh4 cells treated with DMSO, 0.5 μM A485 (a histone acetyltransferase inhibitor), or 0.5 μM entinostat (a histone deacetylase inhibitor). Average signal is shown in arbitrary units (a.u.) across the entire genome, divided into 5-kb bins. (C–F) Non-normalized (C and E) and PerCell-normalized (D and F) signal of the same samples at representative loci decorated with histone H3 acetylation, including TCF3 (C and D) and RPL22 (E and F), respectively.