
FIGURE
Fig. 5
- ID
- ZDB-FIG-250714-84
- Publication
- Tallan et al., 2025 - Highly quantitative measurement of differential protein-genome binding with PerCell chromatin sequencing
- Other Figures
- All Figure Page
- Back to All Figure Page
Fig. 5
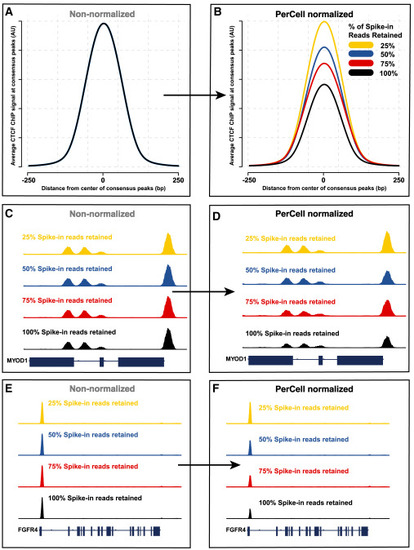
Quantitative PerCell differences in relative genome sizes (A and B) Non-normalized (A) and PerCell-normalized (B) CTCF ChIP signal in Rh4 human rhabdomyosarcoma cancer cells with varying percentages of cellular spike-in reads removed (resulting in 25%, 50%, 75%, or 100% of reads being retained) before application of the PerCell pipeline. Signal is shown ±250 bp of consensus CTCF called peaks. (C–F) Non-normalized (C and E) and PerCell-normalized (D and F) signal at the MYOD1 (C and D) or FGFR4 (E and F) locus. |
Expression Data
Expression Detail
Antibody Labeling
Phenotype Data
Phenotype Detail
Acknowledgments
This image is the copyrighted work of the attributed author or publisher, and
ZFIN has permission only to display this image to its users.
Additional permissions should be obtained from the applicable author or publisher of the image.
Full text @ Cell Rep Methods