
|
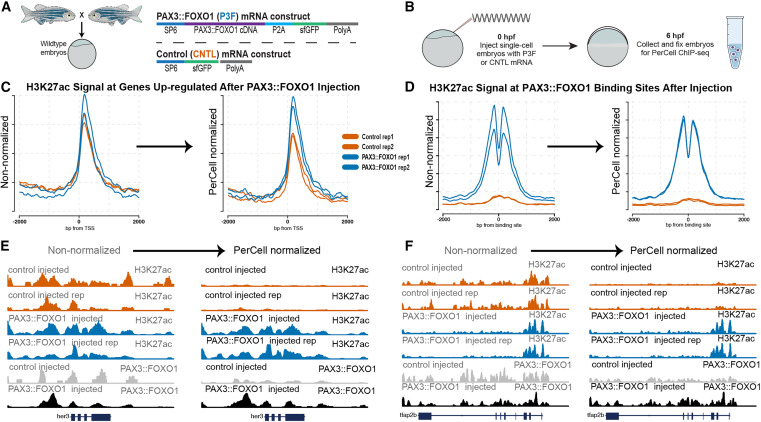
Fig. 4 Zebrafish injected with control vs. PAX3::FOXO1 (P3F) mRNA in anti-H3K27ac and anti-FOXO1 (P3F) PerCell ChIP-seq experiments (A and B) Experimental design workflow, including PAX3::FOXO1 (P3F) and control mRNA constructs (A) and our zebrafish embryo injection strategy (B). (C and D) Profile plots of non-normalized (left) versus normalized (right) data for control and P3F construct injection at upregulated genes (C) or known P3F genomic binding sites (D). (E and F) Genome browser views at the her3 (E) and the tfap2b gene loci (F), where P3F expression in zebrafish embryos increases adjacent histone H3K27ac levels, which can be quantified with PerCell ChIP-seq. In each case, the magnitude of P3F binding is also measured with our PerCell workflow.