
- Title
-
Alpha-synuclein mutations mislocalize cytoplasmic p300 compromising autophagy, which is rescued by ACLY inhibition
- Authors
- Son, S.M., Siddiqi, F.H., Lopez, A., Ansari, R., Tyrkalska, S.D., Park, S.J., Kunath, T., Metzakopian, E., Fleming, A., Rubinsztein, D.C.
- Source
- Full text @ Neuron
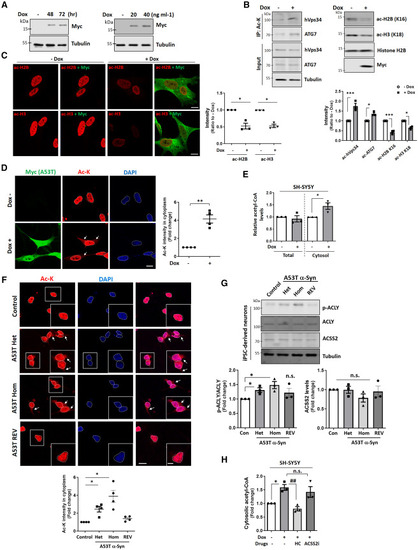
Acetyl-CoA-related pathway is dysregulated in A53T α-Syn neurons through ACLY activation (A) Validation of doxycycline (Dox) inducible A53T α-Syn expressing SH-SY5Y cell lines. Blots are representative of three biologically independent experiments (n = 3). (B) Differential regulation of acetylation between nuclear and cytoplasmic proteins by inducing A53T α-Syn for 72 h. n = 3 independent experiments, two-tailed paired t test. ∗p < 0.05, ∗∗∗p < 0.001 vs. A53T α-Syn-inducible SH-SY5Y cells without Dox. (C) Reduced acetylation of histones (H2B at Lys16 and H3 at Lys18) after Dox treatment for 72 h. n = 3 independent experiments, ≥40 cells scored per condition per experiment. Two-tailed paired t test. ∗p < 0.05 vs. A53T α-Syn-inducible SH-SY5Y cells without Dox. Scale bar, 5 μm. (D) Enhanced acetyl-lysine signals (Ac-K) in cytoplasm after inducing A53T α-Syn for 72 h. n = 4 independent experiments, ≥30 cells scored per condition per experiment. Two-tailed paired t test. ∗∗p < 0.01 vs. A53T α-Syn-inducible SH-SY5Y cells without Dox. Scale bar, 5 μm. Arrows indicate acetylation signal in cytoplasm. (E) Increased acetyl-CoA levels in cytosolic fraction of A53T α-Syn-inducible SH-SY5Y cells induced for 48 h. n = 3 independent experiments, two-tailed paired t test. ∗p < 0.05 vs. A53T α-Syn-inducible SH-SY5Y cells without Dox. (F) Enhanced acetylation signals in cytoplasm in iPSC-derived A53T α-Syn dopaminergic (mDA) neurons. n = 4 independent experiments, ≥30 cells scored per condition per experiment. Two-tailed paired t test. ∗p < 0.05 vs. control. Scale bar, 5 and 2 μm (enlarged images). Arrows indicate acetylation signal in cytoplasm. (G) Increased phosphorylation of ACLY by heterozygous and homozygous A53T α-Syn in mDA neurons. n = 3 independent experiments, two-tailed paired t test. ∗p < 0.05 vs. control. (H) Rescue of increased acetyl-CoA levels in cytoplasm of A53T α-Syn expressing cells by specific ACLY inhibitor, not ACSS2 inhibitor (ACSS2i). n = 3 independent experiments, one-way ANOVA with post hoc Tukey test. ∗p < 0.05 vs. control cells; ##p < 0.01 vs. Dox-treated cells induced for 48 h. Data are presented as mean values ± SEM unless otherwise specified. See also Figures S1 and S2. |
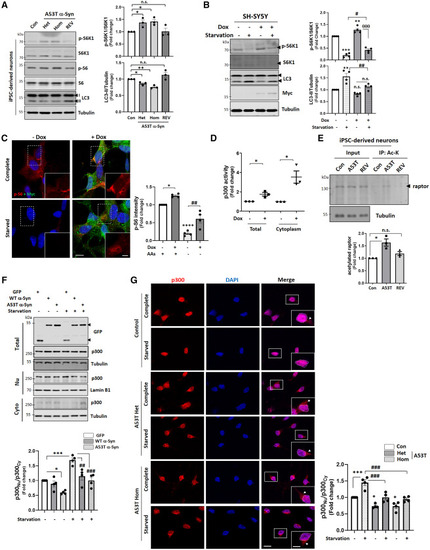
A53T α-Syn mutant regulates mTORC1 and then autophagy by regulating p300 localization (A) Activated mTORC1 and autophagy inhibition in A53T α-Syn mDA neurons. Blots are representative of three biologically independent experiments (n = 3). Two-tailed paired t test. ∗p < 0.05, ∗∗p < 0.01 vs. control iPSC-derived neurons. (B) mTORC1 activation and autophagy inhibition by A53T α-Syn in SH-SY5Y cells induced for 48 h. n = 4 independent experiments, one-way ANOVA with post hoc Tukey test. ∗∗p < 0.01, ∗∗∗p < 0.001 vs. control cells; #p < 0.05, ##p < 0.01 vs. starved control cells; θθθ p < 0.001 vs. Dox-treated cells. (C) Activation of mTORC1 signaling (phosphorylated S6) by inducing A53T α-Syn induced for 48 h. n = 4 independent experiments, ≥30 cells scored per condition per experiment. One-way ANOVA with post hoc Tukey test. ∗p < 0.05, ∗∗∗∗p < 0.0001 vs. control cells; ##p < 0.01 vs. starved control cells. Scale bars, 5 and 2 μm (enlarged images). (D) Enhanced p300 activity by A53T α-Syn in SH-SY5Y cells. n = 3 independent experiments, two-tailed paired t test. ∗p < 0.05 vs. control cells. (E) Increased acetylation of raptor in A53T α-Syn mDA neurons. n = 3 independent experiments, two-tailed paired t test. ∗p < 0.05 vs. control iPSC-derived neurons. (F) Decrease in nuclear translocation of p300 after starvation in SH-SY5Y cells transiently expressing GFP-tagged WT or A53T α-Syn. n = 4 independent experiments, one-way ANOVA with post hoc Tukey test. ∗p < 0.05, ∗∗∗p < 0.001 vs. GFP transfected control cells; ##p < 0.01, ###p < 0.001 vs. GFP transfected starved cells. (G) Localization of p300 in control or A53T α-Syn iPSC-derived neurons in complete or starvation media. Scale bar, 5 and 2 μm (enlarged images). n = 4 independent experiments, ≥30 cells scored per condition per experiment. One-way ANOVA with post hoc Tukey test. ∗p < 0.05, ∗∗∗p < 0.001 vs. control iPSC-derived neurons; ###p < 0.001 vs. starved neurons. Arrowheads indicate p300 signals in the cytoplasm. Data are presented as mean values ± SEM unless otherwise specified. See also Figure S3. |
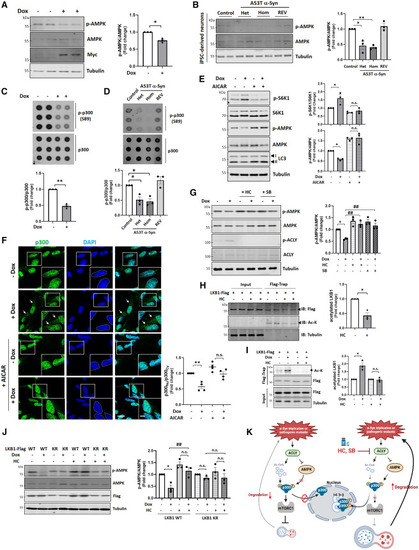
AMPK inhibition by A53T α-Syn ACLY regulates p300-mediated mTORC1 activity and autophagic flux (A and B) Reduced AMPK activity (phosphorylation of AMPK) by A53T α-Syn in SH-SY5Y cells induced with Dox for 48 h (A) or A53T α-Syn mDA neurons (B). Blots are representative of at least three independent experiments (n = 3). Two-tailed paired t test. ∗p < 0.05, ∗∗p < 0.01 vs. A53T α-Syn-inducible SH-SY5Y cells without Dox (A) or control neurons (B). (C and D) Dot blot assay showing inhibition of phosphorylated p300 levels at Ser89 by A53T α-Syn in SH-SY5Y cells induced with Dox for 48 h (C) or A53T α-Syn mDA neurons (D). n = 3 independent experiments, two-tailed paired t test. ∗p < 0.05, ∗∗p < 0.01 vs. A53T α-Syn-inducible SH-SY5Y cells without Dox (C) or control neurons (D). (E) Rescue of mTORC1 activation and reduced LC3-II levels after treatment with 0.25 mM AICAR for 24 h. n = 3 independent experiments, one-way ANOVA with post hoc Tukey test. ∗p < 0.05 vs. A53T α-Syn-inducible SH-SY5Y cells without Dox. Dox induction used for 48 h. (F) Localization of p300 in A53T α-Syn-inducible SH-SY5Y cells induced with Dox for 48 h with treatment with 0.25 mM AICAR for 24 h. Scale bar, 5 and 2 μm (enlarged images). n = 4 independent experiments, ≥30 cells scored per condition per experiment. One-way ANOVA with post hoc Tukey test. ∗∗p < 0.01 vs. A53T α-Syn-inducible SH-SY5Y cells without Dox. Arrows indicate p300 signals in the cytoplasm. (G) Rescue of decreased AMPK activity after treatment with ACLY inhibitors 10 mM HC or 10 μM SB-204990. n = 3 independent experiments, one-way ANOVA with post hoc Tukey test. ∗p < 0.05 vs. A53T α-Syn-inducible SH-SY5Y cells without Dox; ##p < 0.01 vs. Dox-treated cells (induced with Dox for 48 h). (H) Decreased acetylation of LKB1 after treatment with 10 mM HC. n = 3 independent experiments. Two-tailed paired t test. ∗p < 0.05 vs. control cells. (I) Increased LKB1 acetylation by A53T α-Syn and is rescued by 10 mM HC treatment. n = 3 independent experiments. Two-tailed paired t test. ∗p < 0.05 vs. A53T α-Syn-inducible SH-SY5Y cells without Dox. (J) Failure of decreased AMPK activity by A53T α-Syn in LKB1 acetylation-dead (KR) mutant expressing HeLa cells. n = 3 independent experiments. One-way ANOVA with post hoc Tukey test. ∗p < 0.05 vs. A53T α-Syn-inducible SH-SY5Y cells without Dox; ##p < 0.01 vs. Dox-treated cells. (K) A schematic diagram of the nuclear localization of p300 by ACLY inhibitors in cells expressing A53T α-Syn. Data are presented as mean values ± SEM unless otherwise specified. See also Figures S4–S6. |
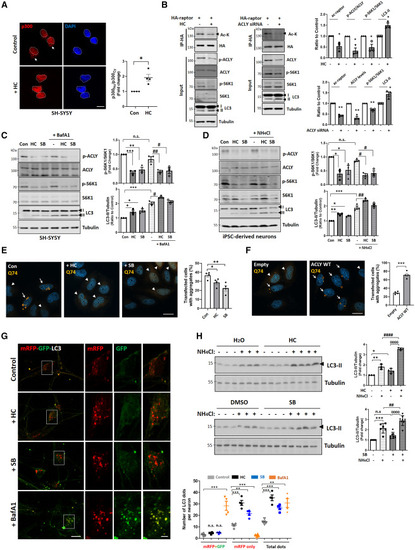
ACLY regulates p300-mediated mTORC1 activity and autophagic flux (A) Nuclear translocation of p300 with 10 mM HC treatment. Scale bar, 5 μm. n = 4 independent experiments, ≥30 cells scored per condition per experiment. Two-tailed paired t test. ∗p < 0.05 vs. control cells. Arrows indicate p300 signals in the cytoplasm. (B) Reduced raptor acetylation after inhibiting ACLY using 10 mM HC for 24 h (left) or by transfecting siRNA (right). n = 3 independent experiments. Two-tailed paired t test. ∗p < 0.05, ∗∗p < 0.01 vs. vehicle-treated or control siRNA transfected cells. (C and D) mTORC1 inhibition and autophagy activation after treating ACLY inhibitors in SH-SY5Y cells (10 mM HC or 10 μM SB-204990 for 24 h) (C) or in iPSC-derived cortical neurons (D). n = 3 independent experiments. Two-tailed paired t test. ∗p < 0.05, ∗∗p < 0.01, ∗∗∗p < 0.001 vs. control cells; #p < 0.05, ##p < 0.01 vs. BafA1 or NH4Cl-treated cells. (E) Reduced HTT (Q74) aggregation in HeLa cells with ACLY inhibitors (10 mM HC or 10 μM SB-204990). Scale bar, 10 μm. N = 4, 40–60 cells scored per condition per experiment. Two-tailed paired t test. ∗p < 0.05, ∗∗p < 0.01 vs. control. Arrows indicate insoluble HTT (Q74); arrowheads indicate soluble HTT (Q74). (F) Enhanced HTT (Q74) aggregation after expressing ACLY WT. Scale bar, 10 μm. n = 4 independent experiments, ≥20 cells scored per condition per experiment. Two-tailed unpaired t test. ∗∗∗p < 0.001 vs. empty vector-transfected cells. Arrows indicate insoluble HTT (Q74); arrowheads indicate soluble HTT (Q74). (G) Autophagic flux in mouse primary cortical neurons from mRFP-GFP-LC3 (tfLC3) transgenic mice. Representative confocal z-stack images (right panel) and total number of mRFP + GFP dots (autophagosomes) and mRFP-only dots (autolysosomes). In total, n = 4 independent experiments, ≥30 cells analyzed per condition per experiment; two-tailed paired t test. ∗∗p < 0.01, ∗∗∗p < 0.001 vs. control cells. Scale bar, 10 and 2 μm (enlarged images). (H) Representative images and quantification of western blots for the levels of LC3-II in WT fish treated either with H2O or 100 μM HC, and 0.1% DMSO or 1 μM SB. Larvae were treated for 24 h from 2 to 3 days post-fertilization (d.p.f.) with the addition of ammonium chloride (where indicated) for the final 4 h of treatment. The inhibition of ACLY by the treatment with SB and HC induces autophagy in WT fish. Graphs show the ratios of LC3-II vs. tubulin normalized to the DMSO value for each clutch. n = 6 independent experiments, mean ± SD; ∗p < 0.05, ∗∗p < 0.01, and ∗∗∗p < 0.001 vs. vehicle-treated control; ##p < 0.01, ####p < 0.0001 vs. DMSO; θθθθp < 0.0001 vs. HC or SB treated fish analyzed by one-way ANOVA with post hoc Tukey test. Data are presented as mean values ± SEM unless otherwise specified. See also Figures S4–S6. |
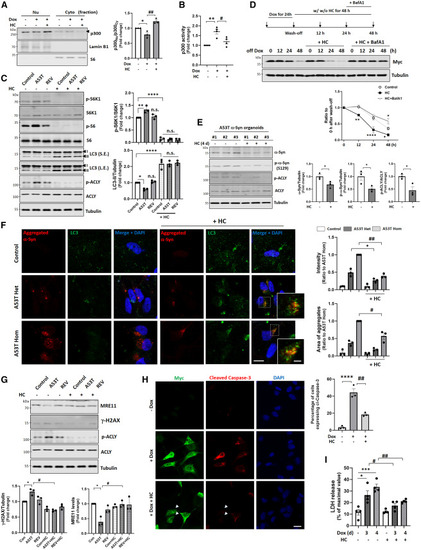
Inhibition of ACLY restores altered autophagy regulation to reduce pathological α-Syn aggregates and rescues pathological phenotypes induced by α-Syn (A) Rescue of p300 localization in cytoplasm by A53T α-Syn after HC treatment. Blots are representative of at least three independent experiments (n = 3). One-way ANOVA with post hoc Tukey test. ∗p < 0.05 vs. A53T α-Syn-inducible SH-SY5Y cells without Dox; ##p < 0.01 vs. Dox-treated cells. (B) Rescue of increased p300 activity in A53T α-Syn-expressing cells by 10 mM HC treatment. n = 4 independent experiments, one-way ANOVA with post hoc Tukey test. ∗p < 0.05 vs. A53T α-Syn-inducible SH-SY5Y cells without Dox; ##p < 0.01 vs. Dox-treated cells. (C) Rescue of impaired autophagy activity in A53T α-Syn mDA neurons by treating 10 mM HC for 48 h. n = 3 independent experiments; one-way ANOVA with post hoc Tukey test. ∗p < 0.05, ∗∗p < 0.01, ∗∗∗∗p < 0.0001 vs. control neurons. (D) Enhanced degradation of myc-tagged A53T α-Syn by treatment with 5 mM HC. Representative western blots of myc-tagged A53T α-Syn-inducible cell lines following different times of Dox removal. n = 3 independent experiments, two-way ANOVA with Bonferroni post test. ∗p < 0.05, ∗∗p < 0.01, ∗∗∗∗p < 0.0001 vs. vehicle-treated cells. (E) Reduced total and phosphorylated α-Syn levels in A53T α-Syn midbrain organoids after treatment with 10 mM HC for 4 days. n = 3 independent experiments, two-tailed paired t test. ∗p < 0.05 vs. A53T α-Syn midbrain organoids without HC. (F) The intensity and the area of α-Syn aggregates in A53T α-Syn mDA neurons after treatment with 10 mM HC for 4 days. n = 3 independent experiments. Two-tailed paired t test. ∗p < 0.05 vs. heterozygous A53T α-Syn mDA neurons; #p < 0.05, ##p < 0.01 vs. homozygous A53T α-Syn mDA neurons. Scale bar, 10 and 2 μm (enlarged images). (G) Rescue of DNA damage in A53T α-Syn mDA neurons after treatment with 10 mM HC for 4 days. n = 3 independent experiments. Two-tailed paired t test. ∗p < 0.05 vs. control neurons; #p < 0.05 vs. homozygous A53T α-Syn mDA neurons. (H) Intensity of cleaved caspase-3 in A53T α-Syn-inducible SH-SY5Y cells after treatment with 10 mM HC for 24 h. Arrowheads indicate A53T α-Syn-expressing cells without cleaved caspase-3 signal. n = 3 independent experiments, one-way ANOVA with post hoc Tukey test. ∗∗∗∗p < 0.0001 vs. control cells; ##p < 0.01 vs. A53T α-Syn-inducible SH-SY5Y cells treated with Dox. Scale bar, 5 μm. (I) Rescue of increased LDH release in A53T α-Syn-inducible SH-SY5Y cells after treatment with 10 mM HC for 24 h. n = 4 independent experiments, one-way ANOVA with post hoc Tukey test. ∗p < 0.05, ∗∗∗p < 0.001 vs. control cells; #p < 0.05, ##p < 0.01 vs. A53T α-Syn-inducible SH-SY5Y cells treated with Dox. Data are presented as mean values ± SEM unless otherwise specified. See also Figure S6. |

ACLY inhibition rescues α-Syn-induced pathology in SNCA zebrafish model (A) Failure of nuclear translocation of p300 by A53T α-Syn expression. Representative images of antibody staining for α-Syn, p300, and DAPI were performed on cryosections across the spinal cord of transgenic Dendra-α-SYN_WT and A53T fish with mosaic expression of the transgene at 2 d.p.f. n = 14 fish per group, two-tailed unpaired t test. ∗p < 0.05 vs. Dendra-α-SYN _WT. Scale bar, 5 μm. (B) Enhanced mTORC1 activity in fish expressing human A53T α-Syn mutation. Representative images and quantification of S6K1 and p-S6K1 western blots to measure mTORC1 activity in fish with pan-neuronal expression of Dendra-α-SYN_WT and A53T at 2 d.p.f. n = 12 independent clutches, two-tailed unpaired t test. ∗p < 0.05 vs. Dendra-α-SYN_WT. (C) Inhibition of autophagic flux in fish carrying the A53T mutation. Representative images and quantification of western blots for the levels of LC3-II in fish with pan-neuronal expression of Dendra-α-SYN_WT or A53T at 2 d.p.f. in basal conditions and after treatment with 10 mM NH4Cl for 4 h. Graph represents the ratios of LC3-II vs. actin normalized to a single negative sibling control run in all blots. The same sample from a negative sibling was run in parallel on every gel and used for normalization of the data. n = 9 independent clutches, one-way ANOVA followed by Sidak’s multiple test comparison. ∗p < 0.05 vs. Dendra-α-SYN_WT; #p < 0.05 vs. Dendra-α-SYN_WT treated with NH4Cl. (D) Decreased phosphorylated α-Syn after treatment with ACLY inhibitors. Representative images and quantification of western blots showing the levels of phosphorylated α-Syn at Ser129 in fish with pan-neuronal expression of Dendra-α-SYN_ A53T treated with 0.1% DMSO, 0.5 or 1 μM SB and 50 or 100 μM HC from 1 to 3 d.p.f. n = 5 independent clutches, two-tailed one-sample t test. ∗∗p < 0.01 vs. DMSO. (E) Inhibition of mTORC1 activity after treatment with ACLY inhibitors. Representative images and quantification of S6 and p-S6 western blots to evaluate the effect of 0.5 μM SB-204990 and 50 μM HC on the mTORC1 activity in fish with pan-neuronal expression of Dendra-α-SYN_A53T treated from 1 to 2 d.p.f. n = 8 independent clutches, two-tailed one-sample t test. ∗p < 0.05 and ∗∗∗p < 0.01 vs. DMSO. (F) In vivo clearance kinetics of Dendra-α-SYN_A53T in neurons of fish treated with 0.1% DMSO (black lines), 0.5 μM SB (green line), or 50 μM HC (blue line) imaged for 48 h at 24 h intervals. Graphs represent the reduction in the percentage (%) of initial red intensity over time. n = 62 neurons/group, Sidak’s multiple comparisons two-way ANOVA. ∗∗p < 0.01, ∗∗∗p < 0.001, and ∗∗∗∗p < 0.0001 vs. DMSO. (G) Clearance of insoluble α-Syn fraction by ACLY inhibition. Representative images and quantification of western blots for the Sarkosyl-soluble and -insoluble fractions of α-Syn in 3 d.p.f. fish with pan-neuronal expression of Dendra-α-SYN_A53T treated either with 0.1% DMSO, 0.5 μM SB, and 50 μM HC. HE, high exposure. n = 5 independent experiments, 40 fish/replicate. Two-tailed one-sample t test. ∗p < 0.05 and ∗∗p < 0.01 vs. DMSO. (H) Rescue of neuronal cell death in Dendra-α-SYN_A53T zebrafish following treatment with ACLY inhibitors. Representative images show terminal deoxynucleotidyl transferase dUTP nick end labeling (TUNEL) in transverse cryosections across zebrafish larvae brains with pan-neuronal expression of Dendra-α-SYN_A53T treated with 0.5 μM SB and 50 μM HC (1 to 2 d.p.f.) along with their A53T-negative sibling controls. The dashed rectangle in the DAPI image highlights the brain region shown at higher magnification for comparison among the groups. Apoptotic nuclei appear as bright dots. Neuronal cell death was assessed by quantifying apoptotic nuclei in the brain (white arrows), excluding other tissues such as eyes or cartilage (yellow arrows). Scale bar: 125 μm. Data are presented as the number of apoptotic neuronal nuclei per fish, quantified across five consecutive sections per fish (n = 20 fish per group). Statistical analysis was performed using a two-tailed unpaired t test. ∗∗∗∗p ≤ 0.0001 vs. A53T-negative sibling fish; ####p ≤ 0.0001 vs. A53T-positive fish treated with DMSO. Data are presented as mean values ± SD unless otherwise specified. |

ACLY inhibition rescues α-Syn-induced pathology in SNCA mouse model (A) Schematic of the study paradigm, including the intracerebroventricular (ICV) infusion by minipump and designated collection time points. (B) p300 localization, mTORC1, and autophagy levels in the brains of SNCA mice after injection with 100 mM HC for 28 days. n = 6 each group, two-tailed unpaired t test. ∗p < 0.05, ∗∗p < 0.01, ∗∗∗p < 0.001 vs. vehicle-injected SNCA mice. (C) Rescue of AMPK activity after injection with 100 mM HC for 28 days. n = 6 each group, two-tailed unpaired t test. ∗p < 0.05 vs. vehicle-injected SNCA mice. (D) Decreased total human α-Syn level after injection with 100 mM HC for 28 days. n = 8 for HC-treated and n = 9 for vehicle control group, two-tailed unpaired t test. ∗∗p < 0.01 vs. vehicle-injected SNCA mice. Scale bar, 20 and 10 μm (enlarged images). Arrowheads indicate human α-Syn signals. (E) Decreased phosphorylated α-Syn at Ser129 after injection with 100 mM HC for 28 days. n = 8 for HC-treated and n = 9 for vehicle control group, two-tailed unpaired t test. ∗p < 0.05 vs. vehicle-injected SNCA mice. Scale bar, 20 and 10 μm (enlarged images). (F) Decreased aggregated α-Syn level after injection with 100 mM HC for 28 days. n = 8 for HC-treated and n = 9 for vehicle control group, two-tailed unpaired t test. ∗∗∗p < 0.001 vs. vehicle-injected SNCA mice. Scale bar, 20 and 10 μm (enlarged images). Arrowheads indicate α-Syn aggregates signals. (G) Reduced γ-H2AX level after injection with 100 mM HC for 28 days. n = 6 each group, two-tailed unpaired t test. ∗p < 0.05 vs. vehicle-injected SNCA mice. (H) Rescue of TH expression in the striatum after injection with 100 mM HC for 28 days. Representative confocal micrographs (maximum intensity projection) and quantification of TH signal (red) in striatal brain slices derived from SNCA mice. Nuclei were counterstained with DAPI. n = 8 for both HC-treated and vehicle control group, n = 4 for WT mice. One-tailed unpaired t test. ∗p < 0.05. Scale bar, 20 μm. (I) Schematic diagram of this study. Data are presented as mean values ± SEM unless otherwise specified. See also Figure S7. |