
Fig. 1
- ID
- ZDB-FIG-250716-15
- Publication
- Son et al., 2025 - Alpha-synuclein mutations mislocalize cytoplasmic p300 compromising autophagy, which is rescued by ACLY inhibition
- Other Figures
- All Figure Page
- Back to All Figure Page
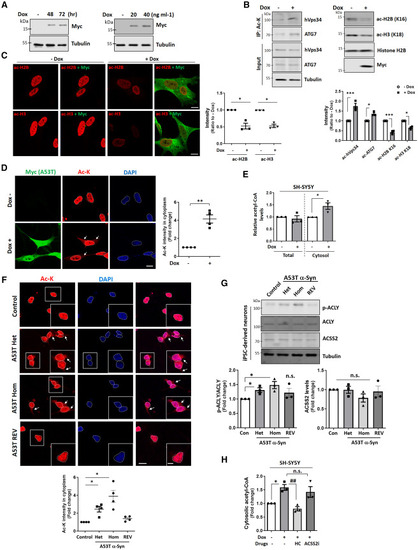
Acetyl-CoA-related pathway is dysregulated in A53T α-Syn neurons through ACLY activation (A) Validation of doxycycline (Dox) inducible A53T α-Syn expressing SH-SY5Y cell lines. Blots are representative of three biologically independent experiments (n = 3). (B) Differential regulation of acetylation between nuclear and cytoplasmic proteins by inducing A53T α-Syn for 72 h. n = 3 independent experiments, two-tailed paired t test. ∗p < 0.05, ∗∗∗p < 0.001 vs. A53T α-Syn-inducible SH-SY5Y cells without Dox. (C) Reduced acetylation of histones (H2B at Lys16 and H3 at Lys18) after Dox treatment for 72 h. n = 3 independent experiments, ≥40 cells scored per condition per experiment. Two-tailed paired t test. ∗p < 0.05 vs. A53T α-Syn-inducible SH-SY5Y cells without Dox. Scale bar, 5 μm. (D) Enhanced acetyl-lysine signals (Ac-K) in cytoplasm after inducing A53T α-Syn for 72 h. n = 4 independent experiments, ≥30 cells scored per condition per experiment. Two-tailed paired t test. ∗∗p < 0.01 vs. A53T α-Syn-inducible SH-SY5Y cells without Dox. Scale bar, 5 μm. Arrows indicate acetylation signal in cytoplasm. (E) Increased acetyl-CoA levels in cytosolic fraction of A53T α-Syn-inducible SH-SY5Y cells induced for 48 h. n = 3 independent experiments, two-tailed paired t test. ∗p < 0.05 vs. A53T α-Syn-inducible SH-SY5Y cells without Dox. (F) Enhanced acetylation signals in cytoplasm in iPSC-derived A53T α-Syn dopaminergic (mDA) neurons. n = 4 independent experiments, ≥30 cells scored per condition per experiment. Two-tailed paired t test. ∗p < 0.05 vs. control. Scale bar, 5 and 2 μm (enlarged images). Arrows indicate acetylation signal in cytoplasm. (G) Increased phosphorylation of ACLY by heterozygous and homozygous A53T α-Syn in mDA neurons. n = 3 independent experiments, two-tailed paired t test. ∗p < 0.05 vs. control. (H) Rescue of increased acetyl-CoA levels in cytoplasm of A53T α-Syn expressing cells by specific ACLY inhibitor, not ACSS2 inhibitor (ACSS2i). n = 3 independent experiments, one-way ANOVA with post hoc Tukey test. ∗p < 0.05 vs. control cells; ##p < 0.01 vs. Dox-treated cells induced for 48 h. Data are presented as mean values ± SEM unless otherwise specified. See also Figures S1 and S2. |