
Fig. 2
- ID
- ZDB-FIG-250716-16
- Publication
- Son et al., 2025 - Alpha-synuclein mutations mislocalize cytoplasmic p300 compromising autophagy, which is rescued by ACLY inhibition
- Other Figures
- All Figure Page
- Back to All Figure Page
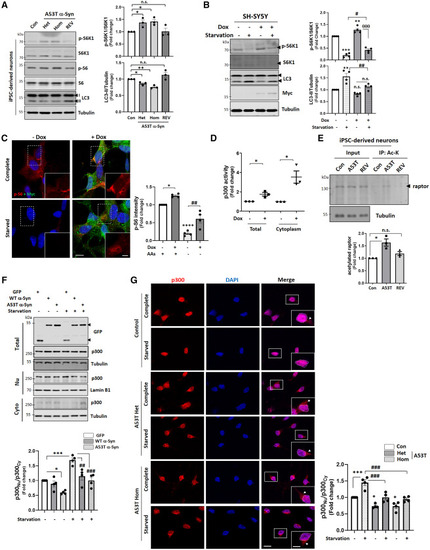
A53T α-Syn mutant regulates mTORC1 and then autophagy by regulating p300 localization (A) Activated mTORC1 and autophagy inhibition in A53T α-Syn mDA neurons. Blots are representative of three biologically independent experiments (n = 3). Two-tailed paired t test. ∗p < 0.05, ∗∗p < 0.01 vs. control iPSC-derived neurons. (B) mTORC1 activation and autophagy inhibition by A53T α-Syn in SH-SY5Y cells induced for 48 h. n = 4 independent experiments, one-way ANOVA with post hoc Tukey test. ∗∗p < 0.01, ∗∗∗p < 0.001 vs. control cells; #p < 0.05, ##p < 0.01 vs. starved control cells; θθθ p < 0.001 vs. Dox-treated cells. (C) Activation of mTORC1 signaling (phosphorylated S6) by inducing A53T α-Syn induced for 48 h. n = 4 independent experiments, ≥30 cells scored per condition per experiment. One-way ANOVA with post hoc Tukey test. ∗p < 0.05, ∗∗∗∗p < 0.0001 vs. control cells; ##p < 0.01 vs. starved control cells. Scale bars, 5 and 2 μm (enlarged images). (D) Enhanced p300 activity by A53T α-Syn in SH-SY5Y cells. n = 3 independent experiments, two-tailed paired t test. ∗p < 0.05 vs. control cells. (E) Increased acetylation of raptor in A53T α-Syn mDA neurons. n = 3 independent experiments, two-tailed paired t test. ∗p < 0.05 vs. control iPSC-derived neurons. (F) Decrease in nuclear translocation of p300 after starvation in SH-SY5Y cells transiently expressing GFP-tagged WT or A53T α-Syn. n = 4 independent experiments, one-way ANOVA with post hoc Tukey test. ∗p < 0.05, ∗∗∗p < 0.001 vs. GFP transfected control cells; ##p < 0.01, ###p < 0.001 vs. GFP transfected starved cells. (G) Localization of p300 in control or A53T α-Syn iPSC-derived neurons in complete or starvation media. Scale bar, 5 and 2 μm (enlarged images). n = 4 independent experiments, ≥30 cells scored per condition per experiment. One-way ANOVA with post hoc Tukey test. ∗p < 0.05, ∗∗∗p < 0.001 vs. control iPSC-derived neurons; ###p < 0.001 vs. starved neurons. Arrowheads indicate p300 signals in the cytoplasm. Data are presented as mean values ± SEM unless otherwise specified. See also Figure S3. |