
Fig. 5
- ID
- ZDB-FIG-250716-19
- Publication
- Son et al., 2025 - Alpha-synuclein mutations mislocalize cytoplasmic p300 compromising autophagy, which is rescued by ACLY inhibition
- Other Figures
- All Figure Page
- Back to All Figure Page
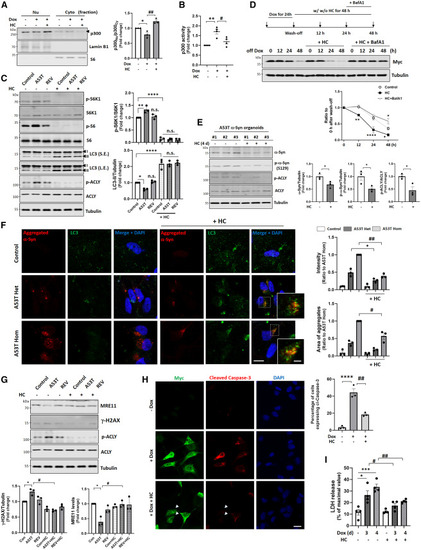
Inhibition of ACLY restores altered autophagy regulation to reduce pathological α-Syn aggregates and rescues pathological phenotypes induced by α-Syn (A) Rescue of p300 localization in cytoplasm by A53T α-Syn after HC treatment. Blots are representative of at least three independent experiments (n = 3). One-way ANOVA with post hoc Tukey test. ∗p < 0.05 vs. A53T α-Syn-inducible SH-SY5Y cells without Dox; ##p < 0.01 vs. Dox-treated cells. (B) Rescue of increased p300 activity in A53T α-Syn-expressing cells by 10 mM HC treatment. n = 4 independent experiments, one-way ANOVA with post hoc Tukey test. ∗p < 0.05 vs. A53T α-Syn-inducible SH-SY5Y cells without Dox; ##p < 0.01 vs. Dox-treated cells. (C) Rescue of impaired autophagy activity in A53T α-Syn mDA neurons by treating 10 mM HC for 48 h. n = 3 independent experiments; one-way ANOVA with post hoc Tukey test. ∗p < 0.05, ∗∗p < 0.01, ∗∗∗∗p < 0.0001 vs. control neurons. (D) Enhanced degradation of myc-tagged A53T α-Syn by treatment with 5 mM HC. Representative western blots of myc-tagged A53T α-Syn-inducible cell lines following different times of Dox removal. n = 3 independent experiments, two-way ANOVA with Bonferroni post test. ∗p < 0.05, ∗∗p < 0.01, ∗∗∗∗p < 0.0001 vs. vehicle-treated cells. (E) Reduced total and phosphorylated α-Syn levels in A53T α-Syn midbrain organoids after treatment with 10 mM HC for 4 days. n = 3 independent experiments, two-tailed paired t test. ∗p < 0.05 vs. A53T α-Syn midbrain organoids without HC. (F) The intensity and the area of α-Syn aggregates in A53T α-Syn mDA neurons after treatment with 10 mM HC for 4 days. n = 3 independent experiments. Two-tailed paired t test. ∗p < 0.05 vs. heterozygous A53T α-Syn mDA neurons; #p < 0.05, ##p < 0.01 vs. homozygous A53T α-Syn mDA neurons. Scale bar, 10 and 2 μm (enlarged images). (G) Rescue of DNA damage in A53T α-Syn mDA neurons after treatment with 10 mM HC for 4 days. n = 3 independent experiments. Two-tailed paired t test. ∗p < 0.05 vs. control neurons; #p < 0.05 vs. homozygous A53T α-Syn mDA neurons. (H) Intensity of cleaved caspase-3 in A53T α-Syn-inducible SH-SY5Y cells after treatment with 10 mM HC for 24 h. Arrowheads indicate A53T α-Syn-expressing cells without cleaved caspase-3 signal. n = 3 independent experiments, one-way ANOVA with post hoc Tukey test. ∗∗∗∗p < 0.0001 vs. control cells; ##p < 0.01 vs. A53T α-Syn-inducible SH-SY5Y cells treated with Dox. Scale bar, 5 μm. (I) Rescue of increased LDH release in A53T α-Syn-inducible SH-SY5Y cells after treatment with 10 mM HC for 24 h. n = 4 independent experiments, one-way ANOVA with post hoc Tukey test. ∗p < 0.05, ∗∗∗p < 0.001 vs. control cells; #p < 0.05, ##p < 0.01 vs. A53T α-Syn-inducible SH-SY5Y cells treated with Dox. Data are presented as mean values ± SEM unless otherwise specified. See also Figure S6. |