
Fig. 4
- ID
- ZDB-FIG-250716-18
- Publication
- Son et al., 2025 - Alpha-synuclein mutations mislocalize cytoplasmic p300 compromising autophagy, which is rescued by ACLY inhibition
- Other Figures
- All Figure Page
- Back to All Figure Page
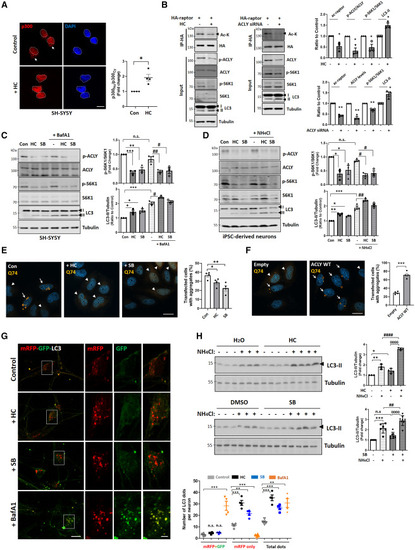
ACLY regulates p300-mediated mTORC1 activity and autophagic flux (A) Nuclear translocation of p300 with 10 mM HC treatment. Scale bar, 5 μm. n = 4 independent experiments, ≥30 cells scored per condition per experiment. Two-tailed paired t test. ∗p < 0.05 vs. control cells. Arrows indicate p300 signals in the cytoplasm. (B) Reduced raptor acetylation after inhibiting ACLY using 10 mM HC for 24 h (left) or by transfecting siRNA (right). n = 3 independent experiments. Two-tailed paired t test. ∗p < 0.05, ∗∗p < 0.01 vs. vehicle-treated or control siRNA transfected cells. (C and D) mTORC1 inhibition and autophagy activation after treating ACLY inhibitors in SH-SY5Y cells (10 mM HC or 10 μM SB-204990 for 24 h) (C) or in iPSC-derived cortical neurons (D). n = 3 independent experiments. Two-tailed paired t test. ∗p < 0.05, ∗∗p < 0.01, ∗∗∗p < 0.001 vs. control cells; #p < 0.05, ##p < 0.01 vs. BafA1 or NH4Cl-treated cells. (E) Reduced HTT (Q74) aggregation in HeLa cells with ACLY inhibitors (10 mM HC or 10 μM SB-204990). Scale bar, 10 μm. N = 4, 40–60 cells scored per condition per experiment. Two-tailed paired t test. ∗p < 0.05, ∗∗p < 0.01 vs. control. Arrows indicate insoluble HTT (Q74); arrowheads indicate soluble HTT (Q74). (F) Enhanced HTT (Q74) aggregation after expressing ACLY WT. Scale bar, 10 μm. n = 4 independent experiments, ≥20 cells scored per condition per experiment. Two-tailed unpaired t test. ∗∗∗p < 0.001 vs. empty vector-transfected cells. Arrows indicate insoluble HTT (Q74); arrowheads indicate soluble HTT (Q74). (G) Autophagic flux in mouse primary cortical neurons from mRFP-GFP-LC3 (tfLC3) transgenic mice. Representative confocal z-stack images (right panel) and total number of mRFP + GFP dots (autophagosomes) and mRFP-only dots (autolysosomes). In total, n = 4 independent experiments, ≥30 cells analyzed per condition per experiment; two-tailed paired t test. ∗∗p < 0.01, ∗∗∗p < 0.001 vs. control cells. Scale bar, 10 and 2 μm (enlarged images). (H) Representative images and quantification of western blots for the levels of LC3-II in WT fish treated either with H2O or 100 μM HC, and 0.1% DMSO or 1 μM SB. Larvae were treated for 24 h from 2 to 3 days post-fertilization (d.p.f.) with the addition of ammonium chloride (where indicated) for the final 4 h of treatment. The inhibition of ACLY by the treatment with SB and HC induces autophagy in WT fish. Graphs show the ratios of LC3-II vs. tubulin normalized to the DMSO value for each clutch. n = 6 independent experiments, mean ± SD; ∗p < 0.05, ∗∗p < 0.01, and ∗∗∗p < 0.001 vs. vehicle-treated control; ##p < 0.01, ####p < 0.0001 vs. DMSO; θθθθp < 0.0001 vs. HC or SB treated fish analyzed by one-way ANOVA with post hoc Tukey test. Data are presented as mean values ± SEM unless otherwise specified. See also Figures S4–S6. |