
|
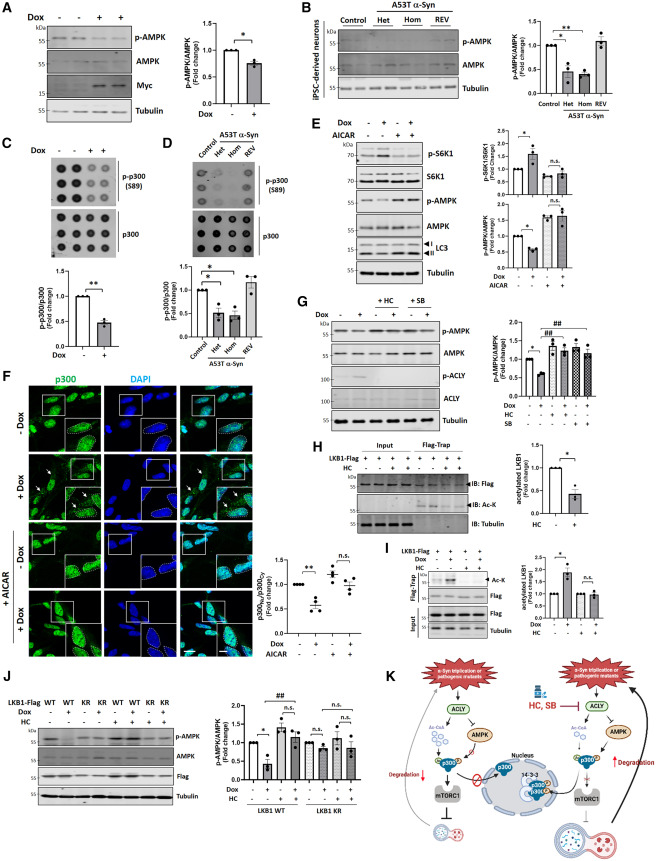
Fig. 3 AMPK inhibition by A53T α-Syn ACLY regulates p300-mediated mTORC1 activity and autophagic flux (A and B) Reduced AMPK activity (phosphorylation of AMPK) by A53T α-Syn in SH-SY5Y cells induced with Dox for 48 h (A) or A53T α-Syn mDA neurons (B). Blots are representative of at least three independent experiments (n = 3). Two-tailed paired t test. ∗p < 0.05, ∗∗p < 0.01 vs. A53T α-Syn-inducible SH-SY5Y cells without Dox (A) or control neurons (B). (C and D) Dot blot assay showing inhibition of phosphorylated p300 levels at Ser89 by A53T α-Syn in SH-SY5Y cells induced with Dox for 48 h (C) or A53T α-Syn mDA neurons (D). n = 3 independent experiments, two-tailed paired t test. ∗p < 0.05, ∗∗p < 0.01 vs. A53T α-Syn-inducible SH-SY5Y cells without Dox (C) or control neurons (D). (E) Rescue of mTORC1 activation and reduced LC3-II levels after treatment with 0.25 mM AICAR for 24 h. n = 3 independent experiments, one-way ANOVA with post hoc Tukey test. ∗p < 0.05 vs. A53T α-Syn-inducible SH-SY5Y cells without Dox. Dox induction used for 48 h. (F) Localization of p300 in A53T α-Syn-inducible SH-SY5Y cells induced with Dox for 48 h with treatment with 0.25 mM AICAR for 24 h. Scale bar, 5 and 2 μm (enlarged images). n = 4 independent experiments, ≥30 cells scored per condition per experiment. One-way ANOVA with post hoc Tukey test. ∗∗p < 0.01 vs. A53T α-Syn-inducible SH-SY5Y cells without Dox. Arrows indicate p300 signals in the cytoplasm. (G) Rescue of decreased AMPK activity after treatment with ACLY inhibitors 10 mM HC or 10 μM SB-204990. n = 3 independent experiments, one-way ANOVA with post hoc Tukey test. ∗p < 0.05 vs. A53T α-Syn-inducible SH-SY5Y cells without Dox; ##p < 0.01 vs. Dox-treated cells (induced with Dox for 48 h). (H) Decreased acetylation of LKB1 after treatment with 10 mM HC. n = 3 independent experiments. Two-tailed paired t test. ∗p < 0.05 vs. control cells. (I) Increased LKB1 acetylation by A53T α-Syn and is rescued by 10 mM HC treatment. n = 3 independent experiments. Two-tailed paired t test. ∗p < 0.05 vs. A53T α-Syn-inducible SH-SY5Y cells without Dox. (J) Failure of decreased AMPK activity by A53T α-Syn in LKB1 acetylation-dead (KR) mutant expressing HeLa cells. n = 3 independent experiments. One-way ANOVA with post hoc Tukey test. ∗p < 0.05 vs. A53T α-Syn-inducible SH-SY5Y cells without Dox; ##p < 0.01 vs. Dox-treated cells. (K) A schematic diagram of the nuclear localization of p300 by ACLY inhibitors in cells expressing A53T α-Syn. Data are presented as mean values ± SEM unless otherwise specified. See also Figures S4–S6.