
- Title
-
Cd248a regulates pericyte development and viability in zebrafish
- Authors
- Wang, C., Zhong, Y., Zhang, Y., Jiang, Y., Wang, C., An, L., Luo, C., Yang, L., He, Z., Yang, Y., Luo, M., Mao, M., Wang, W., Liu, Q., Shi, Y., Ping, Y.F.
- Source
- Full text @ Commun Biol
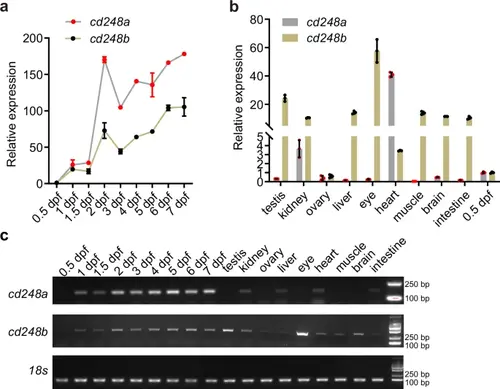
Relative temporal and spatial gene expression of cd248a and cd248b.Relative expression levels of cd248a and cd248b at different developmental stages (a) and in various adult zebrafish tissues (b). Gene expression values were normalized to the level at 0.5 dpf (n = 3 biologically independent experiments). c Semi-quantitative RT-PCR analysis of mRNA expression for cd248a and cd248b at different developmental stages and in different adult zebrafish tissues. Data are presented as the mean ± SD. EXPRESSION / LABELING:
|
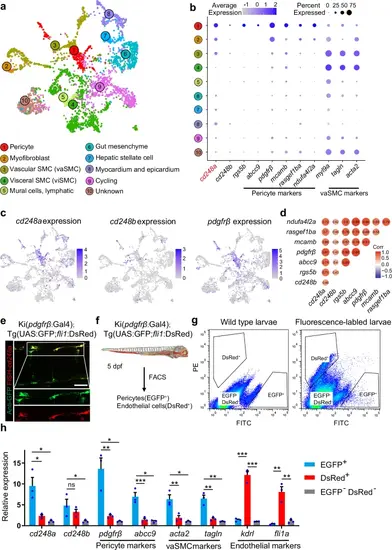
cd248a is highly expressed in pericytes.a Using publicly available single-cell sequencing data set (GSE223922), we show a UMAP projection of 3866 non-skeletal muscle cells collected from whole zebrafish embryos at 50 different developmental stages between 14 and 120 hpf. b Dot plots showing the expression of cd248a, cd248b, and selected pericyte and vascular smooth muscle cell (vaSMC) markers in the indicated clusters. The size of the dot corresponds to the percentage of cluster cells expressing the indicated gene. Color intensity reflects the relative mean expression per cell. c UMAP plots of gene expression (blue dots) highlight individual cells that express cd248a, cd248b, and pdgfrβ. Darker blue dots indicate higher gene expression, while gray dots indicate no gene expression. d Correlation analysis of cd248a, cd248b and other pericyte marker genes. e Labeling of FISH-cd248a (shown in red) and anti-GFP (shown in green) in the Tg(pdgfrβ:Gal4; UAS:GFP) larvae at 4 dpf. Scale bars = 50 μm. f Schematic of the experimental design for sorting pericytes and endothelial cells. g Graphed data of representative FACS analysis of EGFP+ and DsRed+ cells from dissociated 5 dpf Tg(pdgfrβ:Gal4; UAS:GFP; fli1:DsRed) larvae. h qRT-PCR analyses of cd248a, cd248b, pericyte marker genes (pdgfrβ and abcc9), vaSMC marker genes (acta2 and tagln) and endothelial cell marker genes (kdrl and fli1a) followed FACS sorting of EGFP+, DsRed+ and double-negative cells. Data were analyzed by One-way ANOVA and presented as mean ± SD (n = 3 biologically independent experiments). *, p < 0.05. **, p < 0.01. ***, p < 0.001. ns: no significance. EXPRESSION / LABELING:
|
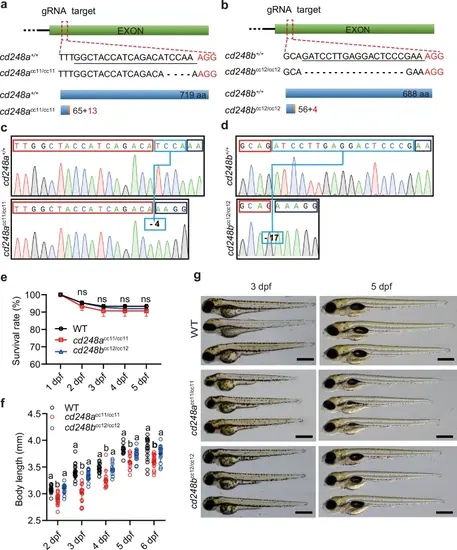
Knockouts of cd248a and cd248b genes in zebrafish using CRISPR/Cas9 system.Diagrams depicting the complete gene structures and deletion mutants of cd248a (a) and cd248b (b). The sgRNA target sequence is underlined. The wild-type Cd248a protein consists of 719 amino acids; the Cd248a mutant (cd248acc11/cc11) consists of only 65 amino acids identical to the wild type and 13 frameshifted amino acids. The wild type Cd248b protein consists of 668 amino acids; the Cd248b mutant (cd248bcc12/cc12) consists of only 56 amino acids identical to wild type and 4 frameshifted amino acids. Sequencing analysis shows indels sites in cd248acc11/cc11 (c) and cd248bcc12/cc12 (d), indicated with the blue box. e Survival rate of cd248acc11/cc11, cd248bcc12/cc12 and wild type zebrafish from 1 to 5 dpf (n = 3 biologically independent experiments). f Body length of cd248acc11/cc11, cd248bcc12/cc12 and wild-type zebrafish from 2 to 6 dpf (n ≥ 12 embryos or larvae). g Representative images of cd248acc11/cc11, cd248bcc12/cc12 and wild-type larvae at 3 dpf and 5 dpf. Scale bars = 500 μm. Data were analyzed using two-way ANOVA and presented as mean ± SD. ns: no significance. Different alphabets (a and b) between groups indicate significant differences (p < 0.05). |
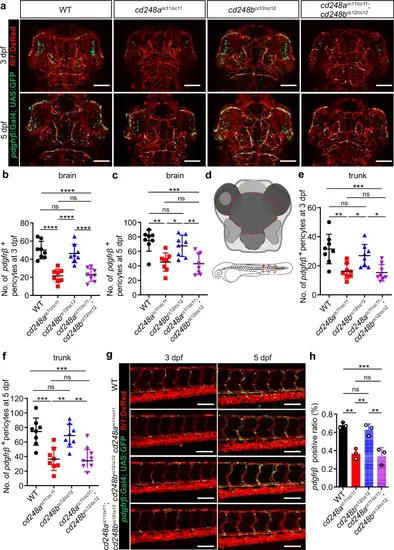
Deficit of pericytes in cd248a mutant zebrafish.Confocal micrograph (a) and quantification of pdgfrβ+ brain pericytes at 3 dpf (b) and 5 dpf (c) in wild-type (WT) and mutant zebrafish (n = 8 embryos or larvae). Scale bars = 100 μm. d Schematic diagram of the counting region, as circled by the red dashed lines. Confocal micrograph (g) and quantification of pdgfrβ+ pericytes in the trunk region at 3 dpf (e) and 5 dpf (f) in wild-type (WT) and mutant zebrafish (n = 8 embryos or larvae). Scale bars = 100 μm. h FACS analysis of the proportion of pdgfrβ+ cells in wild-type and mutant fishes (n = 3 biologically independent experiments). Data were analyzed by One-way ANOVA and presented as mean ± SD. *, p < 0.05. **, p < 0.01. ***, p < 0.001.****, p < 0.0001. ns: no significance. PHENOTYPE:
|
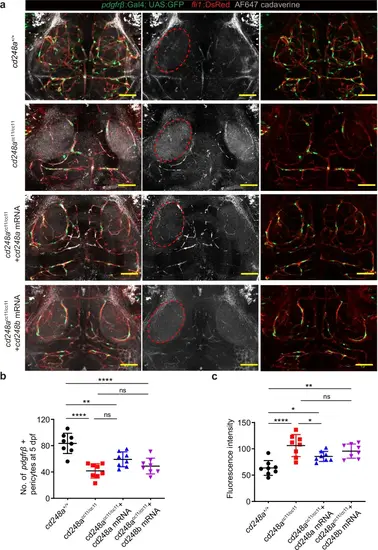
The defective BBB in cd248acc11/cc11 zebrafish can be rescued by cd248a mRNA.a Cerebrovascular images showing infiltration of cadaverine in the extravascular space, as indicated by red circle. Scale bar = 50 μm. b Quantification of pdgfrβ+ brain pericytes in cd248a+/+ and cd248acc11/cc11 larvae with or without mRNA injection (n = 8 larvae). c Quantitative analysis of fluorescence intensity within the red circle area (n = 8 larvae). Data were analyzed by One-way ANOVA and presented as mean ± SD. *, p < 0.05. **, p < 0.01. ****, p < 0.0001. ns: no significance. PHENOTYPE:
|
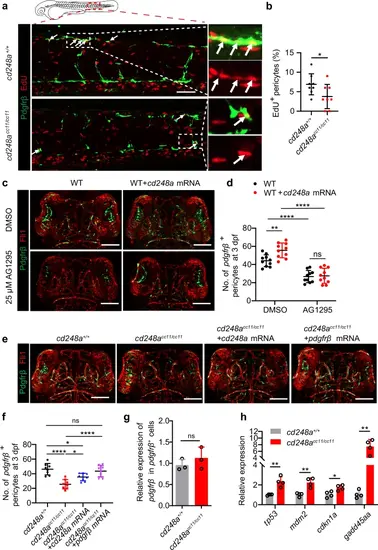
cd248a regulates pericyte proliferation in a Pdgfrβ function-dependent manner.a Confocal micrograph showing pericytes (pdgfrβ+ cells, green) and EdU staining (red) in cd248a+/+ and cd248acc11/cc11 larvae. Arrows indicate EdU-positive pericytes. Scale bar = 50 μm. b Quantification of the percentage of EdU-positive pericytes at 3 dpf, represented as the ratio of the number of EdU-positive pericytes to the total number of pericytes within the imaging area (n = 8 embryos). Confocal micrograph (c) and quantification (d) of brain pericytes at 3 dpf in WT and cd248a-overexpressing groups with or without exposure to AG1295 (n = 10 embryos). Scale bar = 100 μm. Confocal micrograph (e) and quantification (f) of brain pericytes at 3 dpf in cd248a+/+ and cd248acc11/cc11 groups with or without mRNA injection (n = 8 embryos). Scale bar = 100 μm. g Relative expression levels of pdgfrβ in pdgfrβ+ cells isolated from cd248a+/+ and cd248acc11/cc11 larvae (n = 3 biologically independent experiments). h Relative expression levels of cell cycle arrest-related genes in pericytes isolated from cd248a+/+ and cd248acc11/cc11 larvae (n = 4 biologically independent experiments). Data in all quantitative panels are presented as mean ± SD; two-tailed unpaired t test (b, g, h), one-way ANOVA (f) and two-way ANOVA (d). *, p < 0.05. **, p < 0.01. ****, p < 0.0001. ns: no significance. EXPRESSION / LABELING:
PHENOTYPE:
|
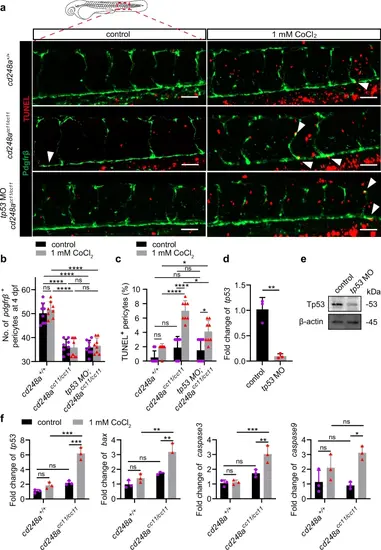
Deletion of cd248a increases hypoxia-induced apoptosis.a Confocal micrograph showing pericytes (pdgfrβ+ cells, green) and TUNEL staining (red) in WT and cd248acc11/cc11 larvae with or without tp53 MO injection at 4 dpf. Arrows indicate TUNEL-positive pericytes. Scale bar = 50 μm. b Quantification of pericyte numbers in WT and cd248acc11/cc11 larvae with or without tp53 MO injection at 4 dpf within the imaging area (n = 8 larvae). c Quantification of the percentage of TUNEL-positive pericytes at 4 dpf represented as a ratio of the TUNEL-positive pericyte to the total number of pericytes within the imaging area (n = 8 larvae). The effectiveness of the tp53 MO in blocking transcription (d) and translation (e) (n = 3 biologically independent experiments). f Relative expression levels of apoptosis-related genes in pericytes isolated from cd248a+/+ and cd248acc11/cc11 larvae with or without exposure to CoCl₂ (n = 3 biologically independent experiments). Data in all quantitative panels are presented as mean ± SD; two-tailed unpaired t test (d), and two-way ANOVA (b, c and f). *, p < 0.05. **, p < 0.01. ***, p < 0.001. ****, p < 0.0001. ns: no significance. |