
|
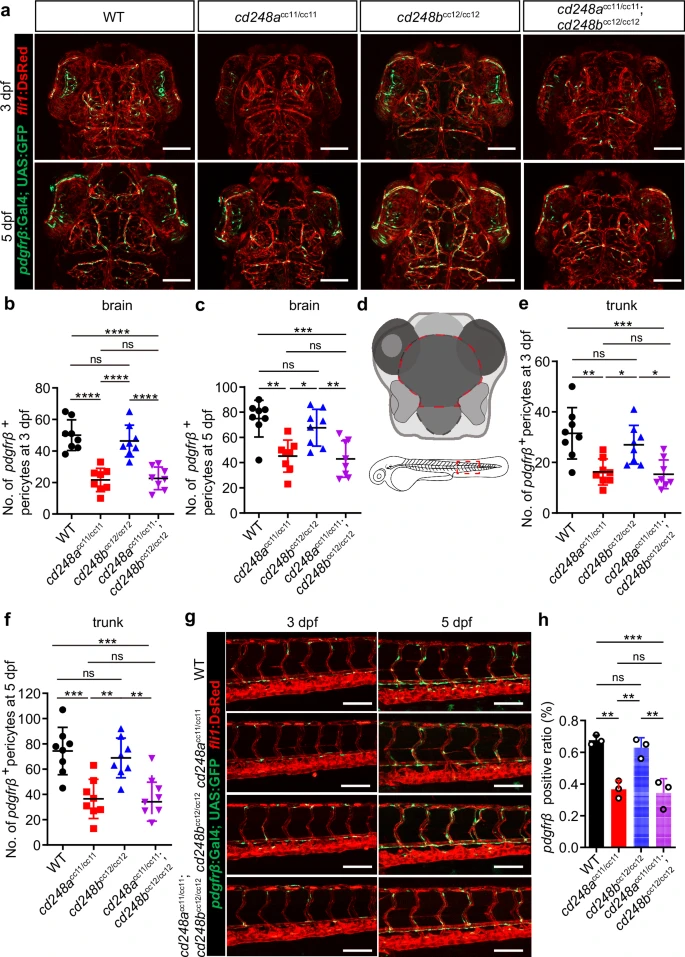
Fig. 4 Deficit of pericytes in cd248a mutant zebrafish.Confocal micrograph (a) and quantification of pdgfrβ+ brain pericytes at 3 dpf (b) and 5 dpf (c) in wild-type (WT) and mutant zebrafish (n = 8 embryos or larvae). Scale bars = 100 μm. d Schematic diagram of the counting region, as circled by the red dashed lines. Confocal micrograph (g) and quantification of pdgfrβ+ pericytes in the trunk region at 3 dpf (e) and 5 dpf (f) in wild-type (WT) and mutant zebrafish (n = 8 embryos or larvae). Scale bars = 100 μm. h FACS analysis of the proportion of pdgfrβ+ cells in wild-type and mutant fishes (n = 3 biologically independent experiments). Data were analyzed by One-way ANOVA and presented as mean ± SD. *, p < 0.05. **, p < 0.01. ***, p < 0.001.****, p < 0.0001. ns: no significance.