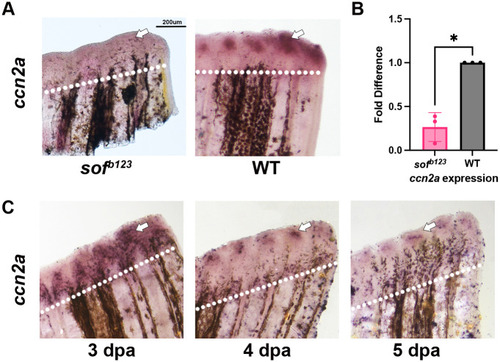
ccn2a is reduced in sofb123 mutants and expression localizes to joints by 4 dpa. (A) Fins were amputated at 50% and harvested at 5 dpa. Amputation planes are denoted by a white dotted line. In situ hybridization was performed using antisense digoxygenin-labeled probe against ccn2a to measure relative gene expression (n=4 per treatment group, with three biological replicates). (B) Reduction of gene expression was quantified through qPCR in both wildtype and sofb123mutants. Graph shows a mean±s.e.m. of three biological replicates fold difference (n=5 fins per replicate). A fold difference of 1 means no change from wild-type expression. Student's t-test (two tailed, unpaired) was used to assess significance with a P-value of 0.01. (C) Fins were amputated at 50% and harvested at 3 dpa, 4 dpa, and 5 dpa. Amputation planes are denoted by white dotted line. In situ hybridization was performed using antisense digoxygenin-labeled probe against ccn2a to measure relative gene expression (n=5 per treatment group, with three biological replicates). Scale bar: 200 µm.
Morpholino (MO)-mediated gene knockdown of Ccn2a reduces segment length in regenerating fins. (A) Illustration of unspliced ccn2a mRNA with Ccn2a-MO1 binding site denoted by a red horizontal line. Primer locations shown used to determine whether ccn2a mRNA was targeted. (B) DNA gel showing amplicons using primer set P1 and P2. The slightly larger band (arrow) in Ccn2a-MO injected fins indicates that intron 2 was retained. The last two lanes show DNA amplified using control primers C1 and C2 (n=5 fins pooled together per cDNA, with three biological replicates). (C) Ccn2a-MO1 and SC-MO were injected into one side of the fin and compared to the uninjected side to calculate percent similarity. MO-injected fins were stained using calcein and measured for segment length (double white arrows). Representative images are shown and data are quantified using the percent similarity method (n=24 per treatment group, with two biological replicates). Insets identify individual segments, joints are indicated by white arrows. (D) Graph displays mean±s.e.m. of percent similarity and showed a significant decrease in segment length compared to SC-MO (two tailed, unpaired Student's t-test P<0.0001). (E) In situ hybridization was performed using an antisense digoxygenin-labeled probe against evx1 to measure gene expression. Expression of evx1 is measured by the frequency of positive or negative expression in fin rays denoted by a plus or minus sign. There are more evx1 positive fin rays in Ccn2a-MO1 injected fins (n=5 per treatment, with three biological replicates). (F) Increase of gene expression was quantified through qPCR in both Ccn2a-MO1 and SC-MO. Graph shows a mean±s.e.m. of three biological replicates fold difference (n=5 fins per replicate). A fold difference of 1 means no change from wild-type expression. Student's t-test (two tailed, unpaired) was used to assess significance with a P-value of 0.02. (G) Cartoon illustration of unspliced ccn2a mRNA with Ccn2a-MO2 binding site denoted by a red horizontal line. Primer locations shown used to determine if ccn2a mRNA was targeted. (H) DNA gel showing amplicons using primer set P1 and P2 for MO2 (n=5 fins pooled together per cDNA, with three biological replicates). (I) Ccn2a-MO2 and SC-MO were injected into one side of the fin and compared to the uninjected side to calculate percent similarity. MO-injected fins were stained using calcein and measured for segment length (white arrows). Representative images are shown and data are quantified using the percent similarity method (n=24 for each treatment with two biological replicates). Insets identify individual segments, joints are indicated by white arrows. (J) Graph displays mean±s.e.m. of percent similarity and showed a significant decrease in segment length compared to SC-MO (two tailed, unpaired Student's t-test P=<0.0001). (K) In situ hybridization was performed using an antisense digoxygenin-labeled probe against evx1 to measure gene expression. Expression of evx1 is measured by the frequency of positive or negative expression in fin rays denoted by a plus or minus sign. There are more evx1 positive fin rays in Ccn2a-MO2 injected fins (n=4 per treatment, with three biological replicates). (L) Increase of gene expression was quantified through qPCR in both Ccn2a-MO1 and SC-MO. Graph shows a mean±s.e.m. of three biological replicates fold difference (n=5 fins per replicate). A fold difference of 1 means no change from wild-type expression. Student's t-test (two tailed, unpaired) was used to assess significance with a P-value of 0.02. Scale bar: 100 µm.
Co-depletion of evx1 and Ccn2a abrogates impacts of Ccn2a-KD on segment length. (A) Ccn2a-MO1 or SC-MO were injected into the dorsal half of evx1+/− regenerating fins and compared to the uninjected side to calculate percent similarity. MO injected fins were stained using calcein and measured for segment length (white double arrows). Representative images are shown and data are quantified using the percent similarity method (n=27 for each treatment, with two biological replicates). Insets identify individual segments, joints are indicated by white arrows. (B) Graph displays mean±s.e.m. of percent similarity and showed there was no significant difference between Ccn2a-MO1 and SC-MO in evx1+/− fins (two tailed, unpaired Student's t-test P=0.15). Scale bar: 100 µm.
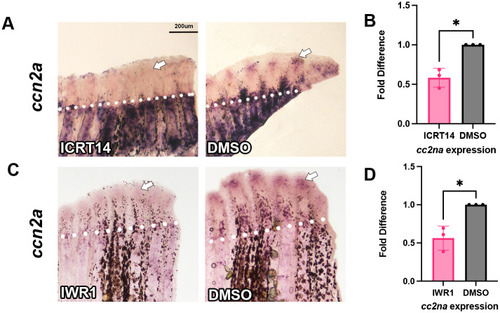
ccn2a expression was decreased with β-catenin inhibition. Fins were amputated at 50% and treated with either 5 µM ICRT14 via injection or 10 µM IWR1 introduced into the water at 72 hpa. Fins were harvested 24 h later at 96 hpa. Amputation planes are denoted by white dotted line. In situ hybridization was performed using antisense digoxygenin-labeled probe against ccn2a to measure relative gene expression. (A) There was a decrease in ccn2a expression in ICRT14 treated fins compared to DMSO. (B) Reduction of gene expression was quantified through qPCR in ICRT14 treated fins. Graph shows a mean of three biological replicates fold difference and standard deviation (n=5 fins per replicate). A fold difference of 1 means no change from wild-type expression. The Student's t-test (two tailed, unpaired) was used to assess significance. (C) There was a decrease in ccn2a expression in IWR1 treated fins compared to DMSO. (D) Reduction of gene expression was quantified through qPCR in IWR1 treated fins. Graph shows a mean of three biological replicates fold difference and standard deviation (n=5 fins per replicate). A fold difference of 1 means no change from wild-type expression. The Student's t-test (two tailed, unpaired) was used to assess significance. Scale bar: 200 µm.
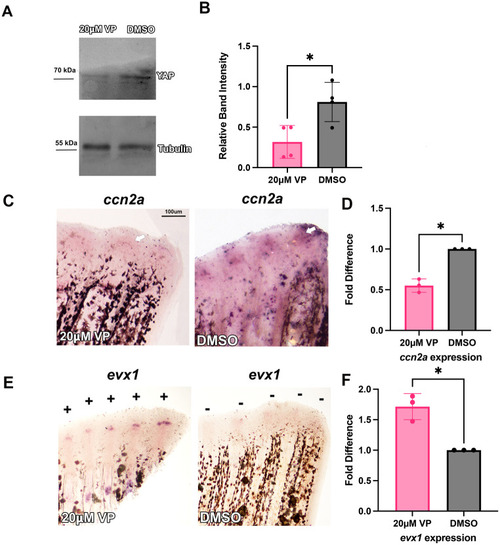
Verteporfin inhibits Yap protein expression and alters ccn2a and evx1 expression. (A) Immunoblotting demonstrates reduced Yap protein expression in zebrafish fin lysates treated with 20 µM Verteporfin (VP) compared to DMSO-treated controls. Protein lysates were extracted from five pooled fins per treatment group. Tubulin was used as a loading control to normalize protein levels. (B) Quantitative analysis of Yap protein expression in zebrafish fins treated with 20 µM Verteporfin (VP) compared to DMSO-treated controls. Band intensity was measured using ImageJ and normalized to Tubulin as a loading control. Data represent the average Yap expression from four independent western blots, each performed using protein lysates from five pooled fins per treatment group. Statistical analysis (two tailed, unpaired Student's t-test P value=0.02) indicates a significant reduction in normalized Yap expression in VP-treated samples compared to controls. (C) Fins were amputated at 50% and treated with 20 µM Verteporfin at 72 hpa via injection. Fins were harvested 24 h later at 96 hpa. Amputation planes are denoted by white dotted line. In situ hybridization was performed using antisense digoxygenin-labeled probe against ccn2a to measure relative gene expression (n=5 for each treatment, with three biological replicates). There is less expression in treated fins when compared to DMSO shown with white arrows. (D) Reduction of ccn2a gene expression was quantified through qPCR in both DMSO and Verteporfin treated fins. Graph shows a mean of three biological replicates fold difference and standard deviation (n=5 fins per replicate). A fold difference of 1 means no change from wild-type expression. The Student's t-test (two tailed, unpaired) was used to assess significance with a P-value of 0.01. (E) In situ hybridization was performed using antisense digoxygenin-labeled probe against evx1 to measure relative gene expression. There is an increase in positive fins rays for evx1 with verteporfin treated fins (n=5 for each treatment with three biological replicates). Increase in evx1 gene expression was quantified through qPCR in both DMSO and Verteporfin treated fins. (F) Graph shows a mean of three biological replicates fold difference and standard deviation (n=5 fins per replicate). A fold difference of 1 means no change from wild-type expression. The Student's t-test (two tailed, unpaired) was used to assess significance with a P-value of 0.02. Scale bar represents 100 µm.
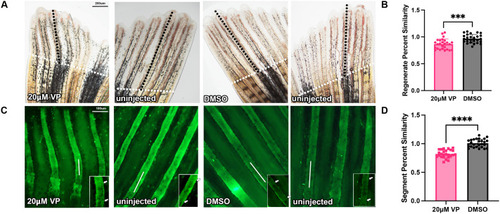
Yap inhibition reduced segment length in regenerating fins. (A) Verteporfin (VP) and DMSO injected fins were calcein stained and measured for regenerate length, indicated by black dotted lines (amputation plane is identified by white dotted lines). Verteporfin or DMSO was injected into one side of the fin and compared to their uninjected side to calculate percent similarity (n=26 for each treatment) with two biological replicates. (B) Graph displays mean±s.e.m. of percent similarity and showed a significant decrease in regenerate length compared to DMSO (two tailed, unpaired Student's t-test P<0.0001). (C) Verteporfin and DMSO injected fins were calcein stained and measured for segment length indicated by white lines and arrows. Verteporfin and DMSO were injected into one side of the fin and compared to their uninjected side to calculate percent similarity (n=26 for each treatment). Insets identify individual segments, joints are indicated by white arrows. (D) Percent similarity was calculated and showed a significant decrease in segment length compared to DMSO (two tailed, unpaired Student's t-test P=0.0001). Scale bars: 200 µm for top images; 100 µm for bottom images.
cx43 and axin2 expression are unchanged with Yap inhibition. Fins were amputated at 50% and treated with 20 µM Verteporfin at 72 hpa via injection. Fins were harvested 24 h later at 96 hpa. Amputation planes are denoted by white dotted line. (A) In situ hybridization was performed using antisense digoxygenin-labeled probe against cx43 to measure relative gene expression (n=4 for each treatment, with three biological replicates). (B) Gene expression was quantified through qPCR in both DMSO and Verteporfin treated fins. Graph shows a mean of three biological replicates fold difference and standard deviation (n=5 fins per replicate). A fold difference of 1 means no change from wild-type expression. The Student's t-test (two tailed, unpaired) was used to assess significance with a P value of 0.32. (C) In situ hybridization was performed using antisense digoxygenin-labeled probe against axin2 to measure relative gene expression (n=4 for each treatment, with three biological replicates). (D) Gene expression was quantified through qPCR in both DMSO and Verteporfin treated fins. Graph shows a mean of three biological replicates fold difference and standard deviation (n=5 fins per replicate). A fold difference of 1 means no change from wild-type expression. The Student's t-test (two tailed, unpaired) was used to assess significance with a P-value of 0.43. Scale bar: 100 µm.
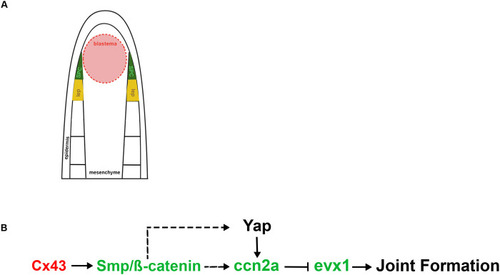
Proposed model for interactions of ccn2a within the Cx43-dependent joint formation pathway. (A) Schematic representation of a longitudinal section of a zebrafish fin ray. The blastema (red), located distally and medially, is composed of proliferative cells driving regeneration. Skeletal precursor cells (SPCs, green), situated laterally, will differentiate into either osteoblasts or joint-forming cells. Newly formed lepidotrichia, or the skeletal elements, are shown in yellow. (B) Cx43 (acting in the cells of the medial blastema, denoted by red text) promotes Smp/β-catenin (acting in the SPCs, denoted by green text), which may promote ccn2a expression (also in SPCs). We show that Ccn2a inhibits evx1, which is required for joint formation. Yap may be regulated downstream of β-catenin or independently.
Acknowledgments
This image is the copyrighted work of the attributed author or publisher, and
ZFIN has permission only to display this image to its users.
Additional permissions should be obtained from the applicable author or publisher of the image.
Full text @ Biol. Open
Your Input Welcome
Thank you for submitting comments. Your input has been emailed to ZFIN curators who may contact you if
additional information is required.
Oops. Something went wrong. Please try again later.