IMAGE

Fig. 3.

ID
ZDB-IMAGE-250306-12
Source
Figures for Hyland et al., 2025
Image
Figure Caption

Fig. 3.

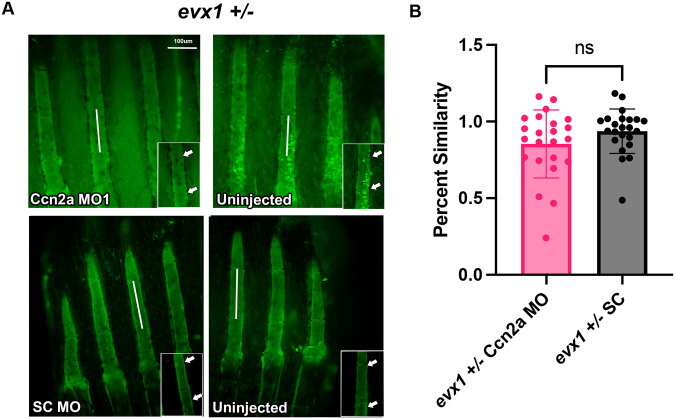
Co-depletion of evx1 and Ccn2a abrogates impacts of Ccn2a-KD on segment length. (A) Ccn2a-MO1 or SC-MO were injected into the dorsal half of evx1+/− regenerating fins and compared to the uninjected side to calculate percent similarity. MO injected fins were stained using calcein and measured for segment length (white double arrows). Representative images are shown and data are quantified using the percent similarity method (n=27 for each treatment, with two biological replicates). Insets identify individual segments, joints are indicated by white arrows. (B) Graph displays mean±s.e.m. of percent similarity and showed there was no significant difference between Ccn2a-MO1 and SC-MO in evx1+/− fins (two tailed, unpaired Student's t-test P=0.15). Scale bar: 100 µm.

Acknowledgments
This image is the copyrighted work of the attributed author or publisher, and ZFIN has permission only to display this image to its users. Additional permissions should be obtained from the applicable author or publisher of the image. Full text @ Biol. Open