IMAGE

Fig. 1.

ID
ZDB-IMAGE-250306-9
Source
Figures for Hyland et al., 2025
Image
Figure Caption

Fig. 1.

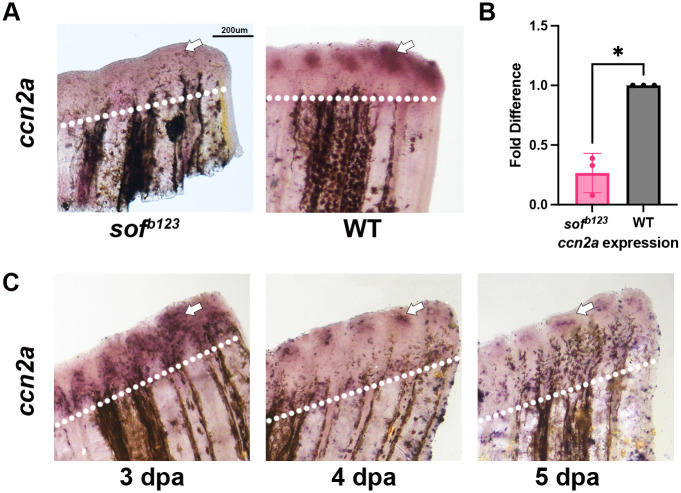
ccn2a is reduced in sofb123 mutants and expression localizes to joints by 4 dpa. (A) Fins were amputated at 50% and harvested at 5 dpa. Amputation planes are denoted by a white dotted line. In situ hybridization was performed using antisense digoxygenin-labeled probe against ccn2a to measure relative gene expression (n=4 per treatment group, with three biological replicates). (B) Reduction of gene expression was quantified through qPCR in both wildtype and sofb123mutants. Graph shows a mean±s.e.m. of three biological replicates fold difference (n=5 fins per replicate). A fold difference of 1 means no change from wild-type expression. Student's t-test (two tailed, unpaired) was used to assess significance with a P-value of 0.01. (C) Fins were amputated at 50% and harvested at 3 dpa, 4 dpa, and 5 dpa. Amputation planes are denoted by white dotted line. In situ hybridization was performed using antisense digoxygenin-labeled probe against ccn2a to measure relative gene expression (n=5 per treatment group, with three biological replicates). Scale bar: 200 µm.

Acknowledgments
This image is the copyrighted work of the attributed author or publisher, and ZFIN has permission only to display this image to its users. Additional permissions should be obtained from the applicable author or publisher of the image. Full text @ Biol. Open