
- Title
-
Neurological function is restored post-ischemic stroke in zebrafish, with aging exerting a deleterious effect on its pathology
- Authors
- Mizoguchi, T., Maki, A., Nakase, Y., Okita, M., Minami, Y., Fukunaga, M., Itoh, M.
- Source
- Full text @ Brain Res. Bull.
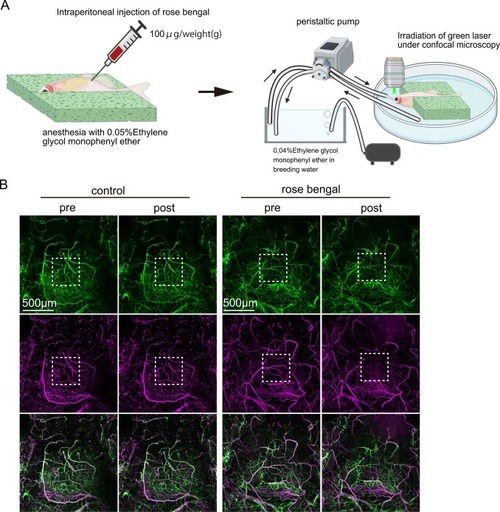
Telencephalon-specific photothrombosis induction in adult zebrafish. (A) Schematic representation of photothrombosis induction in the adult zebrafish brain. The anesthetized fish was positioned dorsally and immobilized with a sponge. Rose bengal was administered intraperitoneally. Subsequently, the fish was repositioned ventrally and immobilized with a sponge, and a green laser was irradiated under confocal microscopy. A peristaltic pump was employed to supply anesthetic to the fish’s mouth. The illustration was created with BioRender.com. (B) The amalgamation of rose bengal injection and laser irradiation could induce thrombosis. White dotted lined areas demarcate the laser irradiation area. Scale bar, 500μm. |
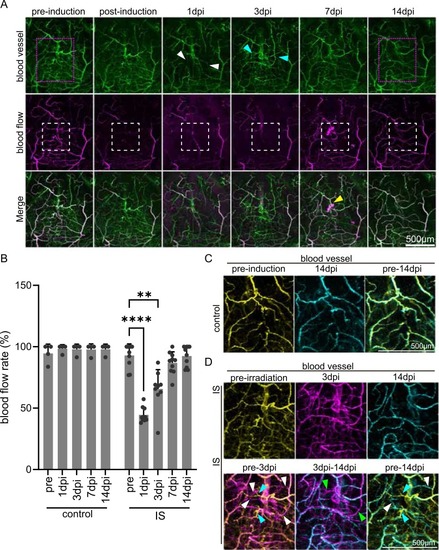
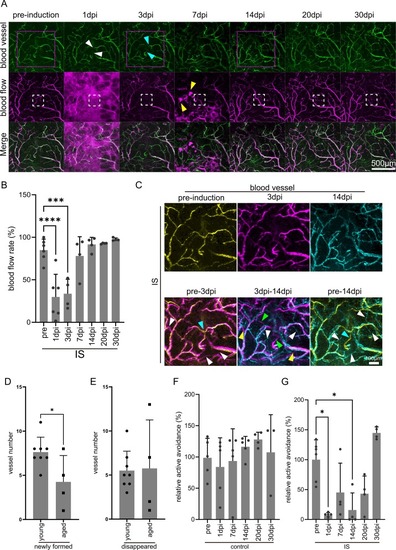
The Cerebral blood vessel network was reconstructed in approximately a week. (A) Temporal imaging of blood vessels and blood flow pre- and post-photothrombosis induction. The white dotted lines demarcate the laser irradiation area in the zebrafish IS model telencephalon. The magenta-dotted lined area corresponds to Fig. 2C. White arrowheads indicate the shrinking of the vessel. Cyan arrowheads indicate the newly formed vessel. A yellow arrowhead indicates spontaneous bleeding. Scale bar, 500μm. (B) Temporal alteration of BFR in control and IS model fish telencephalon. Each gray bar represents the average of BFR. Each dot represents an individual value. ** and **** denote significant differences. **, p < 0.01; ****, p < 0.0001, Kruskal-Wallis with Dunn’s multiple comparison test. n = 4 (WT), 10 (IS model). (C) Comparison of the blood vessel pattern between pre-laser-irradiation and 14 dpi in the control. A yellow panel represents the vessel pattern pre-irradiation, and a cyan panel represents that at 14 dpi. (D) Comparison of the blood vessel pattern among pre-laser-irradiation, 3dpi, and 14dpi in IS model telencephalon. A yellow panel represents the vessel pattern pre-irradiation, a magenta panel represents that at 3 dpi, and a cyan panel represents that at 14 dpi. Lower panels show the merged view of pre- and 3 dpi, 3 dpi and 14 dpi, and pre- and 14 dpi, respectively. Cyan arrowheads indicate vessels that have disappeared, white arrowheads indicate newly formed vessels, and green arrowheads indicate vessels that were newly formed at 3 dpi but pruned by 14 dpi. |
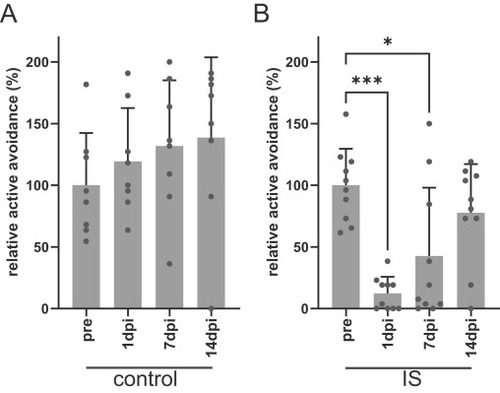
Learning ability was recovered in 14 dpi. (A), (B) Temporal alteration of active avoidance in control (A) and IS (B) model fish. Each gray bar represents the average of active avoidance (%). Each dot represents an individual value. *, **, and **** denote significant differences. *, p < 0.05; ***, p < 0.0001, Kruskal-Wallis with Dunn’s multiple comparison test. n = 8 (WT), 10 (IS model). |
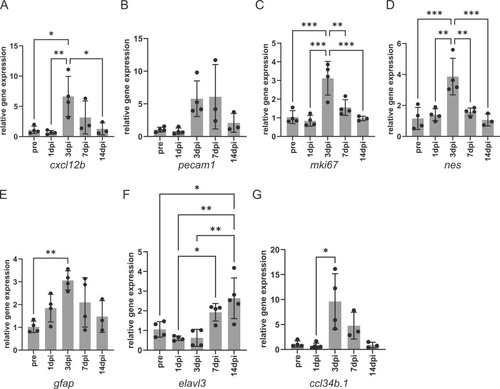
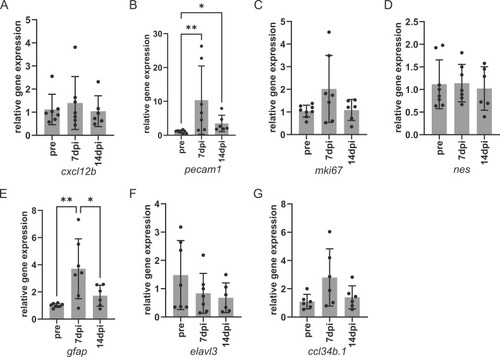
Marker gene expression was altered post-IS induction in young fish. The outcomes of qRT–PCR analysis of gene expression. Vascular endothelial cells, cxcl12b (A) and pecam1 (B); proliferation cells, mki67 (C); neural stem, nes (D); radial glia, gfap (E): differentiated neuron, elavl3(F); microglia, ccl34b.1(G). Each bar represents the average of the relative expression. Error bar, SD. The black dots indicate the individual expression levels (n = 3–5). *, **, and *** denote significant differences. *, p < 0.05; **, p < 0.01; ***, p < 0.001, one-way ANOVA with Tukey’s multiple comparison test in (A)-(F) and Kruskal-Wallis test with Dunn’s multiple comparison test in (G) |
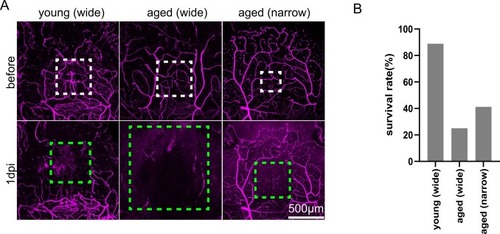
Aging exacerbates IS pathology. (A) When thrombosis was induced in aged fish under the same conditions as young fish, blood flow ceased in a broader area. By narrowing the laser irradiation range, a similar range of blood flow cessation was induced in young fish. The white dot line indicates the laser irradiation area. The green dot line indicates the area where the blood flow ceased. Scale bar, 500μm. (B) Survival rate at 4 dpi. The sample sizes comprised 9 subjects in the young wide group, 7 in the aged wide group, and 15 in the aged narrow group. |
Aging affects the recovery of learning ability. (A) Temporal imaging of blood vessels and blood flow pre- and post-photothrombosis induction in aged fish. The white dotted lines indicate the laser irradiation area in the zebrafish IS model telencephalon. The magenta dotted lines correspond to Fig. 6C. White arrowheads indicate the shrinking of the vessel. Cyan arrowheads indicate the newly formed vessel. Yellow arrowheads indicate spontaneous bleeding. Scale bar, 500μm. (B) Each gray bar indicates the average of BFR. Each dot indicates an individual value. ns denotes no significant difference, *** and **** denote significant differences. ***, p < 0.001; ****, p < 0.0001; one-way ANOVA with Dunnett’s multiple comparison test. n = 4–6. (C) Comparison of the blood vessel pattern between pre-laser-irradiation and 14 dpi in aged IS model telencephalon. The yellow panel represents the vessel pattern pre-irradiation, the magenta panel represents that at 3 dpi, and the cyan panels represent that at 14 dpi. Lower views show that the merged view of pre-laser-irradiation and 3 dpi, 3 dpi and 14 dpi, and pre-laser-irradiation and 14 dpi, respectively. Cyan arrowheads indicate disappeared vessels, white arrowheads indicate newly formed vessels, green arrowheads indicate disappeared vessels that remained at 3 dpi, and green arrowheads indicate disappeared vessels that were newly formed at 3 dpi. (D) The number of vessels newly formed post-IS. *, p < 0.05 Student’s t-test. n = 8 (young) and 4 (aged). (E) The number of vessels disappeared post-IS. There was no significant difference between young and aged, Student’s t-test. n = 8 (young) and 4 (aged). (F, G) Temporal alteration of active avoidance in aged control (F) and aged IS model (G). Each gray bar indicates the relative active avoidance (%). Each dot indicates an individual value. * denote significant differences. *, p < 0.05, Kruskal-Wallis test with Dunn’s multiple comparison test. n = 4–6. |
Marker gene expression was not altered post-IS induction in aged fish. Vascular endothelial cells, cxcl12b (A) and pecam1 (B); proliferation cells, mki67 (C); neural stem, nes (D); radial glia, gfap (E); differentiated neuron, elavl3 (F); microglia, ccl34b.1(G). Each bar represents the average of the relative expression. Error bar, SD. The black dots indicate the individual expression levels (n = 6–8). * and ** denote significant differences. *, p < 0.05; **, p < 0.01, Kruskal-Wallis test with Dunn’s multiple comparison test in (B), and one-way ANOVA with Tukey’s multiple comparison test in (E). There was no significant difference among pre, 7dpi, and 14dpi with Kruskal-Wallis test with Dunn’s multiple comparison test in (A) and (D), one-way ANOVA with Tukey’s multiple comparison test in (C), (F), and (G). |