
Fig. 6
- ID
- ZDB-FIG-250312-21
- Publication
- Mizoguchi et al., 2025 - Neurological function is restored post-ischemic stroke in zebrafish, with aging exerting a deleterious effect on its pathology
- Other Figures
- All Figure Page
- Back to All Figure Page
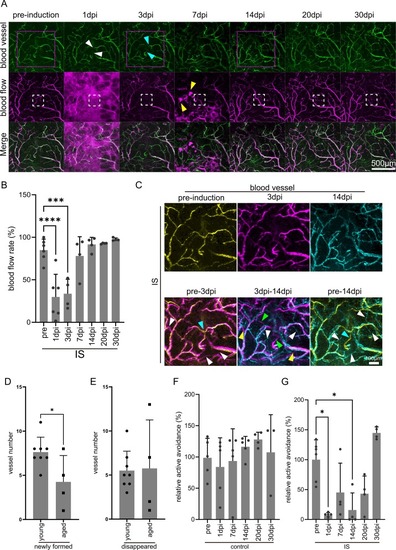
Aging affects the recovery of learning ability. (A) Temporal imaging of blood vessels and blood flow pre- and post-photothrombosis induction in aged fish. The white dotted lines indicate the laser irradiation area in the zebrafish IS model telencephalon. The magenta dotted lines correspond to Fig. 6C. White arrowheads indicate the shrinking of the vessel. Cyan arrowheads indicate the newly formed vessel. Yellow arrowheads indicate spontaneous bleeding. Scale bar, 500μm. (B) Each gray bar indicates the average of BFR. Each dot indicates an individual value. ns denotes no significant difference, *** and **** denote significant differences. ***, p < 0.001; ****, p < 0.0001; one-way ANOVA with Dunnett’s multiple comparison test. n = 4–6. (C) Comparison of the blood vessel pattern between pre-laser-irradiation and 14 dpi in aged IS model telencephalon. The yellow panel represents the vessel pattern pre-irradiation, the magenta panel represents that at 3 dpi, and the cyan panels represent that at 14 dpi. Lower views show that the merged view of pre-laser-irradiation and 3 dpi, 3 dpi and 14 dpi, and pre-laser-irradiation and 14 dpi, respectively. Cyan arrowheads indicate disappeared vessels, white arrowheads indicate newly formed vessels, green arrowheads indicate disappeared vessels that remained at 3 dpi, and green arrowheads indicate disappeared vessels that were newly formed at 3 dpi. (D) The number of vessels newly formed post-IS. *, p < 0.05 Student’s t-test. n = 8 (young) and 4 (aged). (E) The number of vessels disappeared post-IS. There was no significant difference between young and aged, Student’s t-test. n = 8 (young) and 4 (aged). (F, G) Temporal alteration of active avoidance in aged control (F) and aged IS model (G). Each gray bar indicates the relative active avoidance (%). Each dot indicates an individual value. * denote significant differences. *, p < 0.05, Kruskal-Wallis test with Dunn’s multiple comparison test. n = 4–6. |