
Image
|
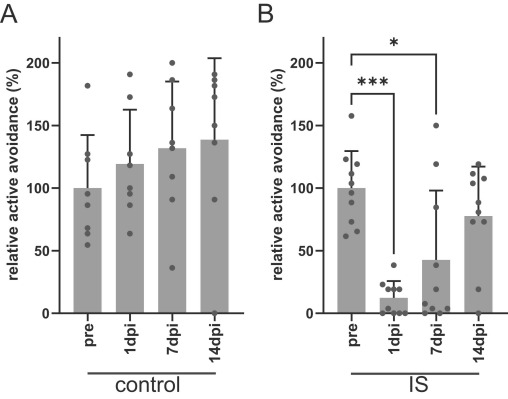
Figure Caption
Fig. 3 Learning ability was recovered in 14 dpi. (A), (B) Temporal alteration of active avoidance in control (A) and IS (B) model fish. Each gray bar represents the average of active avoidance (%). Each dot represents an individual value. *, **, and **** denote significant differences. *, p < 0.05; ***, p < 0.0001, Kruskal-Wallis with Dunn’s multiple comparison test. n = 8 (WT), 10 (IS model).
Acknowledgments
This image is the copyrighted work of the attributed author or publisher, and
ZFIN has permission only to display this image to its users.
Additional permissions should be obtained from the applicable author or publisher of the image.
Full text @ Brain Res. Bull.