
|
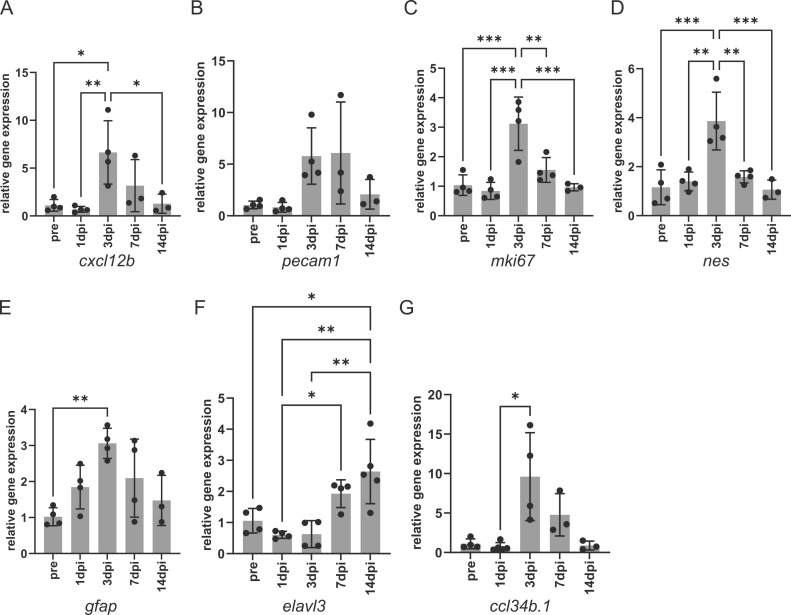
Fig. 4 Marker gene expression was altered post-IS induction in young fish. The outcomes of qRT–PCR analysis of gene expression. Vascular endothelial cells, cxcl12b (A) and pecam1 (B); proliferation cells, mki67 (C); neural stem, nes (D); radial glia, gfap (E): differentiated neuron, elavl3(F); microglia, ccl34b.1(G). Each bar represents the average of the relative expression. Error bar, SD. The black dots indicate the individual expression levels (n = 3–5). *, **, and *** denote significant differences. *, p < 0.05; **, p < 0.01; ***, p < 0.001, one-way ANOVA with Tukey’s multiple comparison test in (A)-(F) and Kruskal-Wallis test with Dunn’s multiple comparison test in (G)