Still heart mutant hearts do not loop and display an expansion of cardiac jelly. At 48 hpf, wild-type hearts have looped, with the ventricle and atrium chambers in different planes of focus (A). Unlike wild-type, our still heart mutant hearts do not loop, which allows for easy visualization of both chambers in a single plane of focus at 48 hpf (B). Wild-type hearts (C) display a thin layer of cardiac jelly (CJ) between the endocardial (END) and myocardial (MYO) layers when compared to still heart mutant hearts (D). Panels C and D are magnifications of the atrial walls from panels A and B, respectively. Quantitative PCR analysis of hyaluronan synthase 2 (has2) at 48 hpf showed that the relative fold change in expression of has2 was significantly higher in still heart mutants when compared to wild-type embryos (E). *** = p ≤ 0.001.

EXPRESSION / LABELING:
Gene:
Fish:
Anatomical Term:
Stage: Long-pec

Still heart mutants lack hand2-migrating cells and hand2 expression in their hearts. At 24 hpf, hand2 expression can be observed in the bilateral cell populations of the anterior lateral plate mesoderm in both wild-type (A) and still heart mutants (B). By 36 hpf, hand2 expression has expanded toward the midline (dotted white line) of wild-type embryos (C), while there is a notable void of hand2 expression proximal to the midline in still heart mutants (D). At 48 hpf, wild-type embryos display hand2 expression in their pharyngeal arches (PAs) and heart (H) (E). Still heart mutants demonstrate hand2 expression in their pharyngeal arches but lack hand2 expression in their hearts (F). Comparison of relative hand2 expression in wild-type and still heart mutants revealed no significant difference in hand2 expression at 24 hpf (G). However, by 48 hpf, still heart mutants demonstrate a significant reduction in the relative fold change in hand2 expression (H). *** = p ≤ 0.001.

Still heart mutants have altered expression of key cardiac transcription factors and cardiac myosins. At 48 hpf, still heart mutants demonstrated a significant reduction in the relative fold change in expression of gata4, gata5, and anf compared to wild-type (A). Other key transcription factors, tbx5a, tbx5b, and tbx20, did not show a significant change in expression in still heart mutants, while the relative expression of tbx2b was elevated. Comparison of cardiac myosin heavy chain expression revealed no significant difference in vmhc expression between still heart and wild-type embryos at 24 hpf (B). Still heart mutants displayed a significantly higher relative fold change in amhc expression at 24 hpf. By 48 hpf, the relative fold change in expression of vmhc and amhc is significantly lower in still heart mutants when compared to wild-type (C). * = p ≤ 0.05, ** = p ≤ 0.01, *** = p ≤ 0.001.

EXPRESSION / LABELING:
Genes:
Fish:
Anatomical Term:
Stage Range: Prim-5 to Long-pec
PHENOTYPE:
Fish:
Observed In:
Stage Range: Prim-5 to Long-pec

Still heart mutant hearts lack incorporation of Isl1-positive cells from the second heart field. At 36 hpf, immunostaining against Isl1, a marker of second heart field cardiac progenitor cells and cardiac neural crest, revealed a lack of Isl1-positive staining in the hearts of still heart mutants when compared to wild-type embryos (AD). Although still heart mutant hearts did not display any Isl1 staining, other tissues derived from neuronal lineages, such as the trigeminal ganglion (TG), were positive for Isl1 (C,D). Still heart mutants continue to lack Isl1 staining in their hearts at 48 hpf when compared to wild-type embryos of the same age (E,F). (Ventricle = V; atrium = A; eye = E).

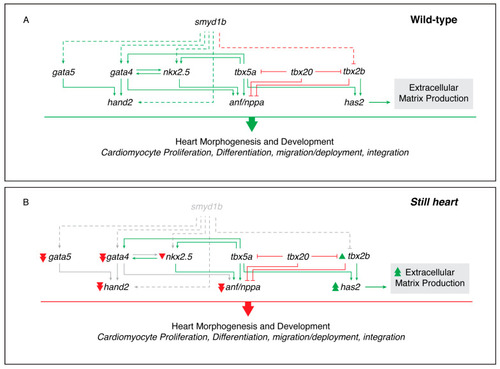
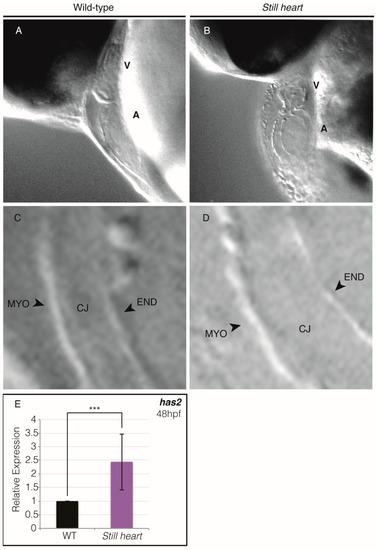
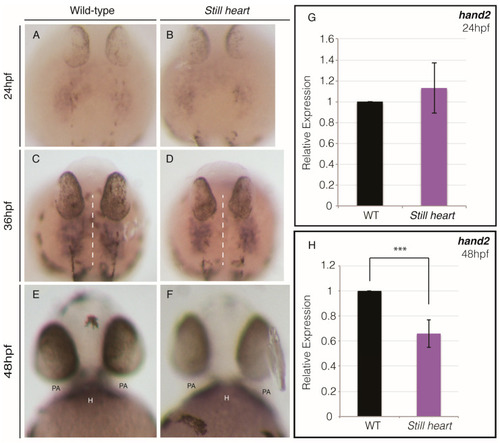
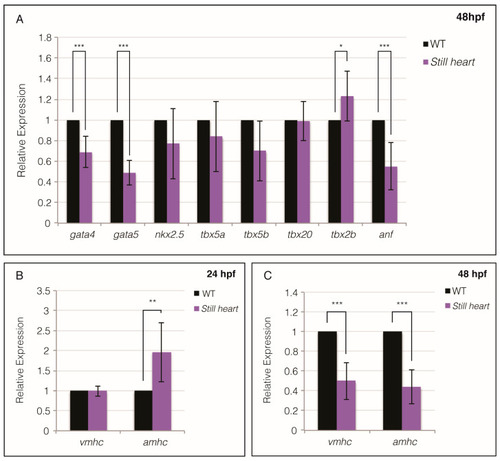
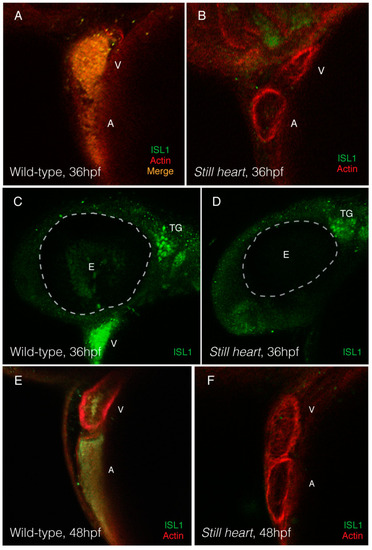
Transcriptional changes in cardiac factors in still heart mutants. A schematic representation of the altered expression of key cardiac transcription factors between wild-type (A) and still heart mutants (B). Genes such as gata4, gata5, hand2, and has2 exhibit significant changes in expression in the absence of Smyd1b. (Solid green line = directly activates transcription; dashed green line = indirectly or directly activates transcription; solid red line = directly inhibits transcription; dashed red line = indirectly or directly activates transcription; gray = absent; single green arrowhead = increased expression; double green arrowhead = significantly increased expression/production; single red arrowhead = decreased expression; double red arrowhead = significantly decreased expression).

ZFIN is incorporating published figure images and captions as part of an ongoing project. Figures from some publications have not yet been curated, or are not available for display because of copyright restrictions.

Acknowledgments
This image is the copyrighted work of the attributed author or publisher, and ZFIN has permission only to display this image to its users. Additional permissions should be obtained from the applicable author or publisher of the image. Full text @ Genes (Basel)