
- Title
-
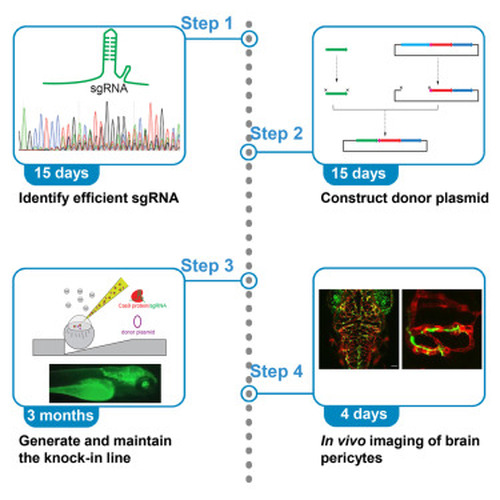
Protocol for generating a pericyte reporter zebrafish line Ki(pdgfrb-P2A-GAL4-VP16) using a CRISPR-Cas9-mediated knockin technique
- Authors
- Zi, H., Peng, X., Du, J., Li, J.
- Source
- Full text @ STAR Protoc
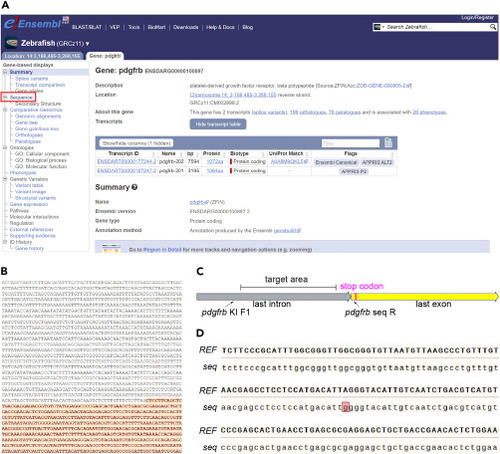
Confirm the sequence of the targeted genomic region of endogenous pdgfrb in the fish we raised (A) Screenshot of the Ensembl site showing the procedure for accessing the sequence of the zebrafish gene pdgfrb. (B) Screenshot of the Ensembl site showing the sequence of Cas9 target region for creating a knockin line targeting pdgfrb, encompassing a partial sequence of the last intron and last exon of pdgfrb. The last exon region is highlighted in red. (C) Screenshot presenting the Cas9 target within pdgfrb gene locus selected for creating knockin line. The stop codon and the primer binding sites are marked. (D) The sequencing results of the targeted region of pdgfrb compare to the reference sequence on Ensembl. REF represents the reference sequence of pdgfrb on Ensembl, seq represents the sequencing results for the target region of pdgfrb. The base marked in red represents the site of SNP. |
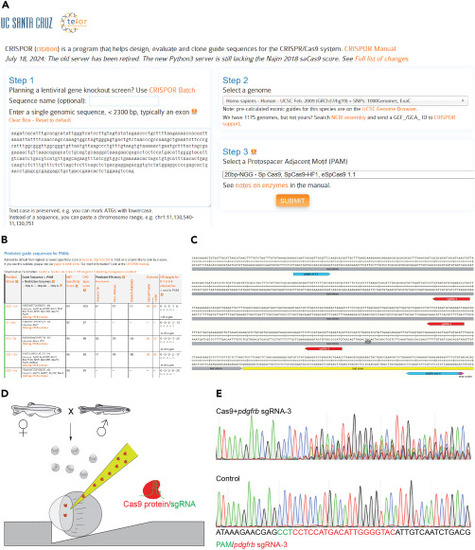
Design the sgRNAs targeting the last intron of pdgfrb (A) Screenshot of the CRISPOR website showing the process of identifying sgRNAs with minimal off-target potential for zebrafish genes. (B) Screenshot showing the list of sgRNAs with lower off-off-target potential (high MIT/CFD Specificity Score) as identified by CRISPOR website for zebrafish pdgfrb. (C) The sites of three sgRNAs chosen for targeting pdgfrb to create knockin line. (D) Schematic representation of the microinjection of Cas9/sgRNA into one-cell stage zebrafish eggs. The eggs are positioned on an agarose plate with the animal pole facing upwards. Cas9 is labeled in red, sgRNA in green, and the solution in the needle in chartreuse. (E) Sequencing result for the larvae injected with Cas9 protein and pdgfrb sgRNA-3. The pdgfrb sgRNA-3 displays high efficiency in inducing indels at the target genomic site, as indicated by significant mixed peaks in the chromatogram. pdgfrb sgRNA-3 binding site, red; PAM area, green. |
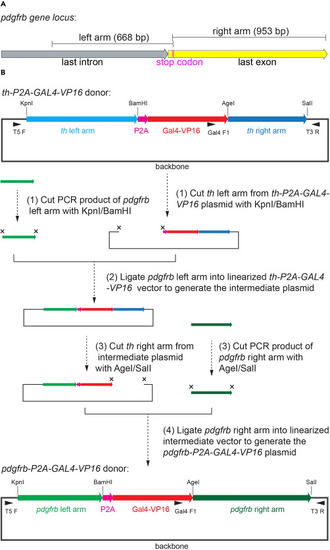
Schematic representation for the generation of pdgfrb-P2A-Gal4-VP16 donor plasmid (A) Schematic representation for the sequences of the left and right arms for the pdgfrb-P2A-Gal4-VP16 donor plasmid in pdgfrb gene locus. The sequence of last intron, last exon and stop codon are marked. (B) Schematic representation of the flow for generating pdgfrb-P2A-Gal4-VP16 donor plasmid. Use the th-P2A-Gal4-VP16 plasmid as backbone, replace the left arm and right arm orderly. The compositions of pdgfrb-P2A-Gal4-VP16 and pdgfrb-P2A-Gal4-VP16 plasmids are shown. The target sites of the restriction endonucleases KpnI, BamHI, AgeI, and SalI are marked. The binding sites of the primers T5F, Gal4 F1, and T3R are marked. |
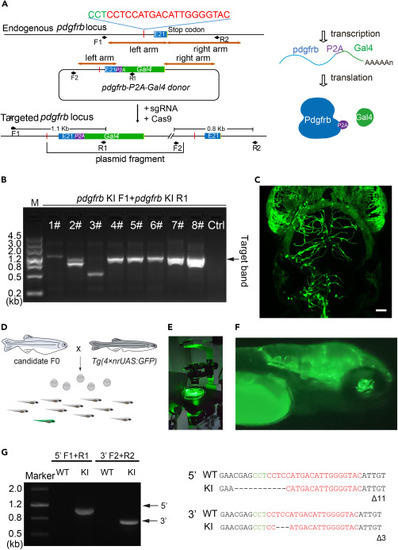
Generation of the Ki(pdgfrb-P2A-Gal4-VP16) line by CRISPR-Cas9 mediated knockin (A) Schematic representation of CRISPR-Cas9 mediated knockin of Gal4-VP16 into the endogenous gene locus of pdgfrb. Cite from Zi et al.1 (B) Gel electrophoresis results assessing the efficiency of knockin of Gal4 into pdgfrb in injected F0 larvae. The primers pdgfrb KI F1/ pdgfrb KI R1 are used for PCR test. M represents the marker. Lanes 1#∼#5, mixture of 10 injected Nacre larvae for each sample; Lanes 6#∼8#, individual injected Tg(UAS:EGFP) larvae exhibiting fluorescent labeling; Lane 7# and Lane 8#, the larvae with extensive fluorescent labeling of brain pericytes; Lane 8 # is shown in (C) as a typical case; Un-injected control larvae (Ctrl) are used for test. The sizes for the ladder of marker are labeled in the left, and the size of target band is marked with arrow in the right. (C) Representative image of pericytes in the brain of the 6.5-dpf Tg(UAS:EGFP) larvae that injected for Ki(pdgfrb-P2A-Gal4-VP16). Imaging was performed with a FV3000 confocal microscope according to the methods described in Step 15. The image is processed with the software ImageJ. Pericyte in green. Scale bar 50 μm. (D) Schematic outlining the screening process for founders by out-crossing, the green represent a GFP positive Ki(pdgfrb-P2A-Gal4-VP16);Tg(4×nrUAS:GFP) larva. (E) Photograph of a fluorescence-capable stereo microscope for fluorescence used to identify the fluorescent signals in the candidate larvae. (F) Representative images of Ki(pdgfrb-P2A-Gal4-VP16);Tg(4×nrUAS:GFP) larvae under the stereo microscope for fluorescence. (G) PCR and sequencing for confirming the knockin of Gal4-VP16 into endogenous pdgfrb locus. The primers pdgfrb KI F1, pdgfrb KI R1,pdgfrb KI F2, pdgfrb KI R2 are used for PCR. The target band for 5′ junction and 3′ junction are marked with arrows. The primer pdgfrb KI F1 is used for sequencing the target band of 5′ junction, and the primer pdgfrb KI F2 is used for sequencing the target band of 3′ junction. The sgRNA binding site is labeled in red, PAM area in green. Cite from Zi et al.1. |
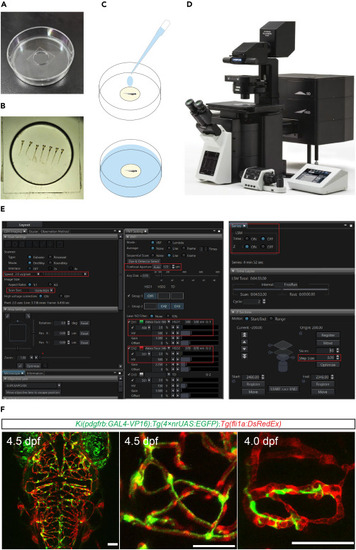
In vivo imaging of zebrafish brains using a confocal microscope (A) Photograph of a 60-mm plastic dish with a 14-mm glass coverslip-filled well. (B) Photographs the larvae embedded in the glass coverslip-filled well of a 60-mm plastic dish. (C) Schematic showing the operation that add ES or Hank’s solution (marked as blue) for the embedded larvae before imaging. (D) Photograph of a FV3000 confocal microscope (Olympus) for in vivo imaging of zebrafish. (E) Screenshot of the software interface (FV31S-SW) for operating the FV3000. The red box marks the settings for scan speed, resolution, aperture, laser intensity, detector voltage, z-series, and z-step positions. (F) Representative images of pericytes and blood vessels in the brain of Ki(pdgfrb-P2A-Gal4-VP16);Tg(4×nrUAS:GFP);Tg(fli1a:DsRed) larvae. These images are processed with the software ImageJ. Pericyte in green, endothelial cell in red. Scale bar 50 μm. |
|